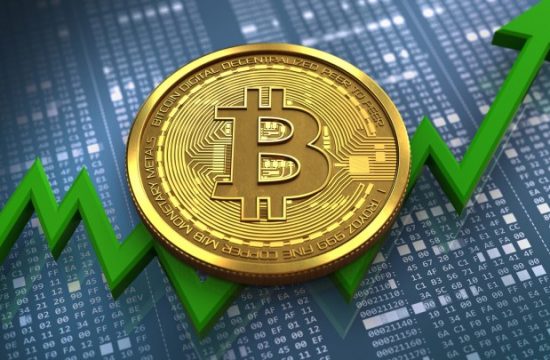
It has been an extremely bullish time for Bitcoin, riding a more-than-80% move up to former all-time highs in October. Bitcoin’s unrelenting performance has made it the best performing asset throughout 2020. In a year marred by pandemic woes, bitcoin is up more than 160% since January. This, despite a precipitous drop of almost 60% in March, according to Giles Coghlan, Chief Currency Analyst at HYCM.
Back at the Peak
An end-of-month rally took bitcoin up to $19,871 on November 30. The number one cryptocurrency would close at $19,709 at both the daily and monthly charts for the first time in the asset’s history, equalling the previous all-time high set back on December 17, 2017. It would actually set a pair of new all-time highs, first at $19,872 on November 30 and then at $19,922 on December 1, but this price action took place in less than two hours and the asset didn’t persist at those levels.
An RSI divergence on both the 4-hour and daily charts, followed by a drop-off in volume early in the month, signalled possible profit-taking and consolidation. This was borne out by a drop to $17,629 on December 9, a failed bounce attempt, and a drop further down to $17,580 on Dec 11. It has since regained this ground as investors appear to be buying the dip, and is currently trading a couple of hundred dollars above that psychologically important $19,000 price point.
Higher for Longer
Bitcoin has been hanging out at these levels now for around three weeks and, despite the recent bounce back up over $19,000, it’s still looking a little toppy, particularly on the daily chart where a lack of follow-through, coupled by dipping RSI levels and a drop-off in volume may be signalling a move that is running out of steam.
An important thing to keep in mind is that strong bullish trends in an asset as volatile as bitcoin can repeatedly confound oscillator-based indicators, such as the RSI. If you look back to 2017’s price action, you’ll notice that on the weekly chart, bitcoin spent most of the year with weekly RSI levels ranging between 60 and 89, with 70 being considered an overbought reading. It whipsawed between these levels back then, while the price went from around $1,000 to $20,000 by year-end.
So, the question on everyone’s mind now, aside from whether the next move is up or down, is how long BTC can range at these levels before a definite bias, either bullish or bearish, reasserts itself. Were it to find support here and range for a while, this would undoubtedly be good news for the rest of the crypto market, which would take any drop-off in BTC volatility as an opportunity to move higher. At the time of writing, bitcoin has already spent around twice as long at these highs as it did back in 2017 when it topped-out just shy of 20k.

20-Week SMA Breaks All-Time High
Bitcoin has spent most of 2019 and 2020 consolidating at higher and higher levels. Back in 2017, its 20-week simple moving average (SMA) never breached $12,000, which shows how short-lived the peak of that bubble was. Bitcoin’s current 20-week SMA reading is at around $13,300 and is trending upwards. During the rally to $14k in the summer of 2019, its 20-week SMA barely reached as high as 10k. A long-term average, like the 20-week, at all-time highs and creeping higher, is an indication that large amounts of the asset have been changing hands for longer periods of time at prices higher than during 2017’s short-lived run-up. This means greater support should it take a dip, and more traders on the sidelines prepared to buy in.
Differing Narratives
What’s particularly noteworthy about Bitcoin’s current place in the broader economic context is that it appears to be riding a number of different narratives that can’t all be true at once. Earlier this year, when it crashed along with everything else at the height of COVID-19 fears, it began behaving like a safe-haven asset, outperforming everything else on the way up. However, when news of the Pfizer vaccine was announced and risk-appetites started to return, it continued trading higher while traditional safe havens like gold and the US dollar have taken a tumble.
Some investors regard it as a hedge against the traditional financial system, others as an asymmetric play. Some think it’s going to zero, for others the moon’s the limit. I’ve even heard it being referred to as a gateway drug for the rest of the crypto market. Whatever the case may be, stay posted, as the next chapter of this exciting asset is about to be written.
by Giles Coghlan, Chief Currency Analyst, HYCM