 Philip Lowe RBA Governor
I would like to thank Australian Industry Group (Ai Group) for the invitation to speak at this lunch today. I have participated in many Ai Group events over the years and I have always valued hearing from your members, so it is a pleasure to be here in Melbourne today.
The title I have chosen for my remarks this afternoon is ‘Productivity, Wages and Prosperity’. I know that these three issues are important to your members and they are also important to the broader Australian community.
Australians enjoy a level of economic prosperity that few other people in the world enjoy. Per capita incomes here are high and so, too, is wealth per capita. We have also avoided bouts of high unemployment for over a quarter of a century now. Our banking system is strong, we have world-class natural resources and Australians have access to high-quality health care and education. So there is much for us to feel fortunate about.
The question is how do we sustain this prosperity?
This is an important question to be asking. At the moment, there is unease in parts of the community about the future of work, about competition from overseas and about the implications of technology – all issues that I know the members of Ai Group are dealing with every day. For others in our community, these concerns are being brought into sharp focus by unusually slow growth in wages.
As we address these important issues, we also need to keep focused on the critical task of raising national productivity. After all, lifting productivity is the key to building on our current prosperity and ensuring sustained growth in wages and incomes. There is no shortage of good ideas to consider here.
My remarks today will be in four parts. First, I will briefly cover the recent economic data. Then, with that context, I will talk about some of the reasons why wages growth has been as low as it has. I will then turn to productivity growth. Finally, I will say a few words about the recent monetary policy decisions by the Reserve Bank Board.
The Recent Economic Data
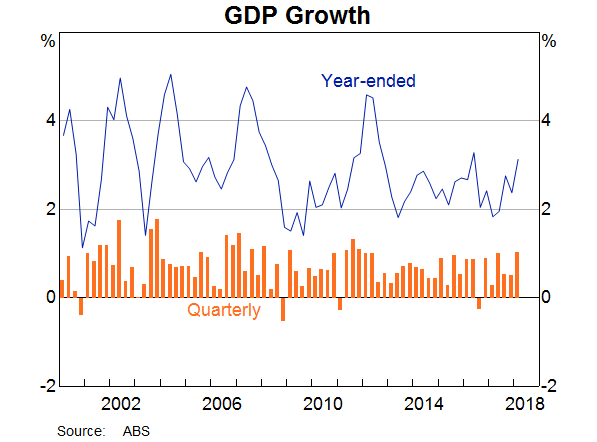
Last week’s national accounts contained positive news about the Australian economy. Over the past year, GDP rose by 3.1 per cent, which is a bit stronger than we were expecting (Graph 1). It is consistent, though, with the RBA’s central scenario for the Australian economy to grow more strongly this year and next than it has over recent years.
Graph 1
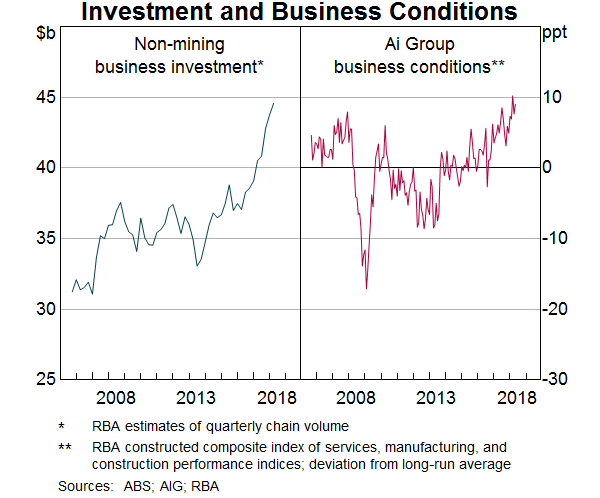
One pleasing feature of the national accounts was the ongoing rise in investment. Non-mining business investment increased by 10 per cent over the past year (Graph 2). This lift is consistent with current business conditions, which, as measured by Ai Group’s own survey, are at the highest level in many years. Investment is also being boosted by increased spending on infrastructure, including in the areas of transport and renewable energy.
Graph 2
One area that we continue to watch carefully is consumption growth. Over the year, household consumption rose by 2.9 per cent. This is a reasonable outcome, although growth in the March quarter was on the soft side. Stronger employment growth has contributed to a pick-up in wage-related income and this is helping to support spending. At the same time, though, the level of household debt remains very high and the housing markets in Sydney and Melbourne are going through a period of adjustment, following the earlier very large increases in prices. Credit standards are also being tightened further. So we are paying close attention to household finances.
On the international front, economic conditions remain strong. The US and Japanese labour markets are quite tight and Asia, including China, is benefiting from the global upswing in trade and investment.
At the same time, though, recent developments have increased some tail risks. One of these is political developments in Italy, which have again put the spotlight on the debt dynamics and underlying tensions in the euro area. Another potential source of a financial shock is the increasing strains in several emerging market economies – including Argentina, Brazil and Turkey. And finally, there is the ongoing risk of an escalation in trade tensions sparked by the policies of the US administration. So, against what remains a reasonably positive international backdrop, these are some of the areas to keep an eye on.
Wages
I would now like to turn to an issue that has received a lot of attention lately; that is wages growth.
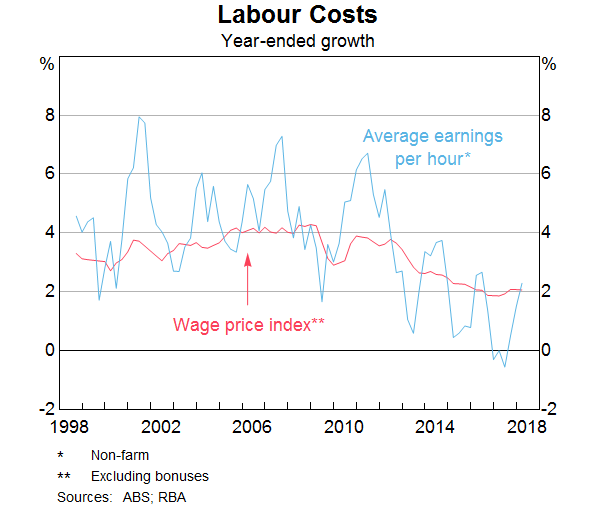
Over recent times, wages growth around the 2 per cent mark has become the norm in Australia. Some time back, the norm was more like 3 to 4 per cent. This downward shift in the rate of wages growth is clearly evident in the wage price index as well as in the more volatile measure of average hourly earnings in the national accounts (Graph 3).
Graph 3
There are both cyclical and structural explanations for why this change has taken place.
From the cyclical perspective, there is still spare capacity in the labour market. The unemployment rate has been around 5½ per cent for a year now (Graph 4). While we can’t be definitive about what constitutes full employment, most conventional estimates for Australia are that it means an unemployment rate of around 5 per cent. It is possible, though, that we could do better than this, especially if we approach the 5 per cent mark at a steady pace, rather than too quickly. Indeed, in a number of other countries, estimates of the unemployment rate associated with full employment are being revised lower as wage increases remain subdued at low rates of unemployment. We have an open mind as to whether this might turn out to be the case here in Australia too. Time will tell.
Graph 4
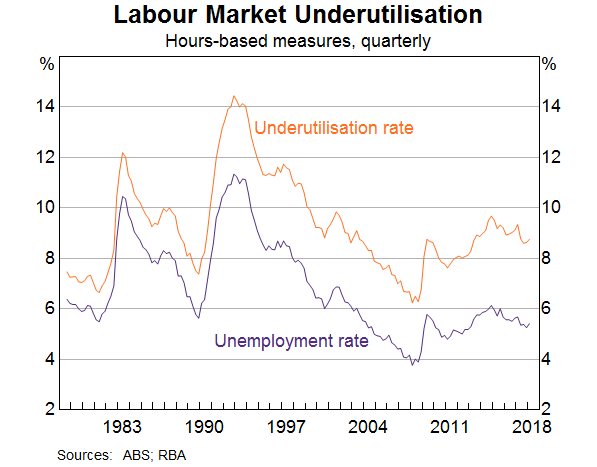
Broader measures of underutilisation suggest another source of spare capacity in the labour market. Currently, around one-third of workers work part time, with most of these people wanting to work part time for personal reasons. However, of those working part time, around one-quarter would like to work more hours than they do; on average, they are seeking an extra two days a week. If we account for this, these extra hours are equivalent to around 3 per cent of the labour force. This suggests an overall labour underutilisation rate of 8¾ per cent, compared with the 5½ per cent traditional unemployment rate measure based on the number of unemployed people.
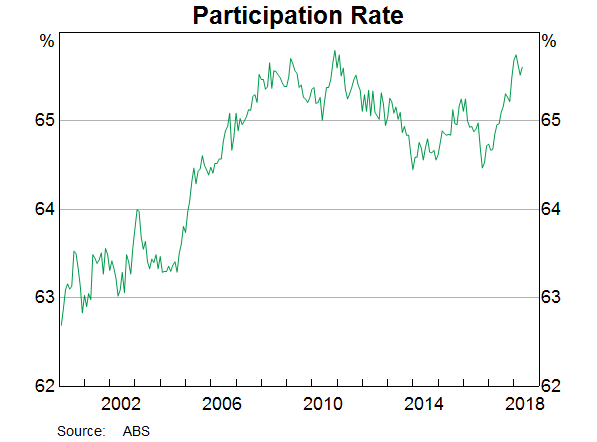
Recent experience also reminds us of another important source of labour supply; that is, higher labour force participation (Graph 5). As we have seen over recent times, when the jobs are there, people stay in the workforce longer and others, who had not been looking for jobs, start looking. So the supply side of the labour market is quite flexible, even more so than we expected.
Graph 5
Another cyclical element that has affected average hourly earnings over recent years is the decline in very highly paid jobs in the resources sector as the boom in mining investment wound down. It looks, though, that this compositional shift has now largely run its course.
These various factors go some way to explaining the low wages growth over recent times. When there is spare capacity in the labour market, it is understandable that wages growth is slow.
Yet, alone, these cyclical factors don’t fully explain what is going on. Some structural factors also appear to be at work, with perhaps the most important of these related to competition and technology. I will come back to this in a moment.
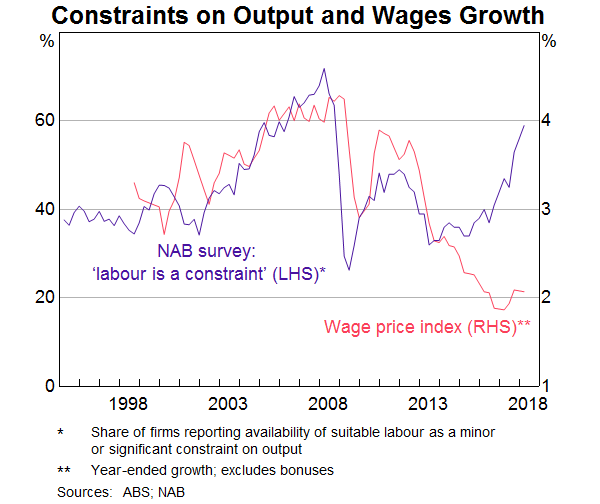
The idea that structural factors are at work is supported by this next graph, which shows the wage price index and the responses to the NAB business survey where firms are asked whether the availability of labour is a constraint on output (Graph 6). While there is still spare capacity in the labour market, firms are finding it more difficult to find suitable workers. Yet despite this difficulty, wages growth has not responded in the way that it once did.
Graph 6
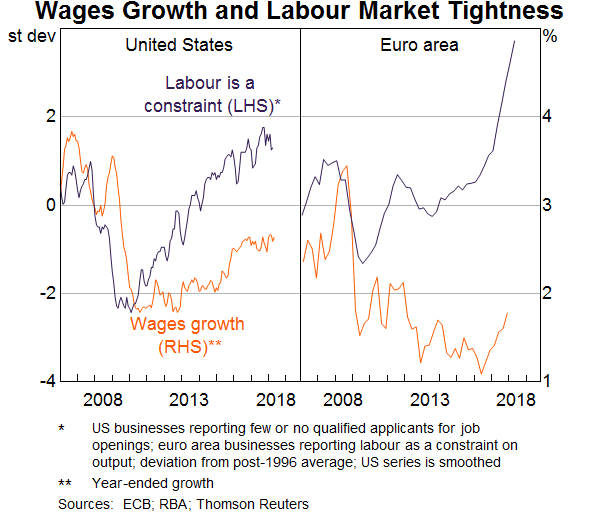
A similar pattern is evident overseas. This next graph shows wages growth in the United States and the euro area as well as survey-based measures of labour market tightness (similar to those in the NAB survey) (Graph 7). In both economies, wages growth has picked up in response to tighter labour markets, but the response is not as large as it has been in the past.
Graph 7
We are still trying to understand fully why things look different in so many countries and how persistent this will be. Part of the story is likely to be changes in the bargaining power of workers and an increase in the supply of workers as the global economy becomes increasingly integrated. But another important part of the story lies in the nature of recent technological progress.
There are a couple of aspects of this progress that are worth pointing out. One is that it has been heavily focused on software and information technology, rather than installing new and better machines – or on intangible capital rather than physical capital. The second is that the dispersion of technology and productivity between leading and lagging firms has increased, perhaps because of the uneven ability of firms to innovate and use the new technologies. The OECD has done some very interesting work documenting this increasing productivity gap.[1]
Both of these aspects of technological progress are affecting wage dynamics. The returns to those who can develop and best use information technology have increased strongly. These returns, though, are often highly concentrated in a few firms and in only certain segments of the labour market. At the same time, the firms that are not able to innovate and take advantage of new technologies as quickly are slipping behind and they feel under pressure. As a way of remaining competitive, many of these firms are responding by having a very strong focus on cost control. In many cases this translates into a focus on controlling labour costs. This cost-control mentality does not make for an environment where firms are willing to pay larger wage increases.
Over time, we can expect the diffusion of new technology to take place. This is what the historical record suggests. I am optimistic that this diffusion will boost aggregate productivity and lift our real wages and incomes. Advances in information technology, in artificial intelligence and in machine learning have the potential to reshape our economies profoundly and lift average living standards in ways that are difficult to envisage today. But the adoption and the diffusion of these new technologies is a gradual process; it takes time. While it is taking place, the benefits of new technologies are accruing unevenly across the community. In my view, this is one of the key structural factors at work.
Whatever weight one places on these various factors constraining wages growth, it is clear that the slow growth in wages is affecting our economy.
On the positive side of the ledger, it is one of the factors that has helped boost employment growth over recent times. Of course, there are other effects as well.
One is that the low growth in wages is contributing to low rates of inflation in Australia. Indeed, if wages growth were to continue at around its current rate for an extended period, it is unlikely that the rate of inflation would average around the midpoint of the inflation target in the period ahead. Wages growth of 2 per cent and reasonable labour productivity growth are unlikely to make for 2½ per cent inflation on a sustained basis.
Another consequence is that real debt burdens stay higher for longer. Many people who borrowed expected their incomes to grow at something like the old rate rather than the current rate. With their expectations not being realised, the real value of the debt stays higher than they expected and this is likely to affect their spending decisions.
And beyond these purely economic effects, the slow wages growth is diminishing our sense of shared prosperity. If this remains the case, it can make needed economic reforms more difficult.
Given these various effects, some pick-up in wages growth would be a welcome development. It would help deliver a rate of inflation consistent with the target, it would help with the debt situation and it would add to our sense of shared prosperity.
In my judgement, a return, over time, to a world where wage increases started with a 3 rather than a 2 is both possible and desirable. To be clear, this is not a call for a sudden jump in wages growth from current rates to 3 point something. Rather, we will be better off if this increase takes place steadily over time as the economy improves.
There are some signs that we are starting to move in this direction, but it is likely to be a gradual process.
Labour markets in most parts of the country have tightened over the past year. One piece of evidence in support of this is the responses to the NAB survey I showed earlier. There has been a sharp increase in the share of firms reporting the availability of labour as a constraint (Graph 6). The only other time in the past 25 years where this share has been as high as it is now was in the early stages of the resources boom. These survey results are consistent with what the RBA is hearing through our own business liaison program.
One explanation for why firms are reporting that it is hard to find workers with the necessary skills is that the very high focus on cost control over recent times has led to reduced work-related training. With the labour market now tightening, we are perhaps starting to pay the price for this. On a more positive note, a number of businesses and industry associations are now starting to address the skills shortage. Some businesses also tell us that another factor that has made it more difficult to find workers with the necessary skills is the tightening of visa requirements.
It’s reasonable to expect that as the labour market tightens, wages growth will pick up. The laws of supply and demand still work. Consistent with this, we hear reports through our liaison program of wages increasing more quickly in areas where there are capacity constraints, although these reports are still not very common.
As part of our liaison program we also ask firms about their expectations for wages growth over the next year: whether it will be lower, higher or about the same as the recent past. The results are shown in this next graph (Graph 8). There are now more firms expecting a pick-up in wages growth and fewer firms expecting a decline compared with recent years.
Graph 8
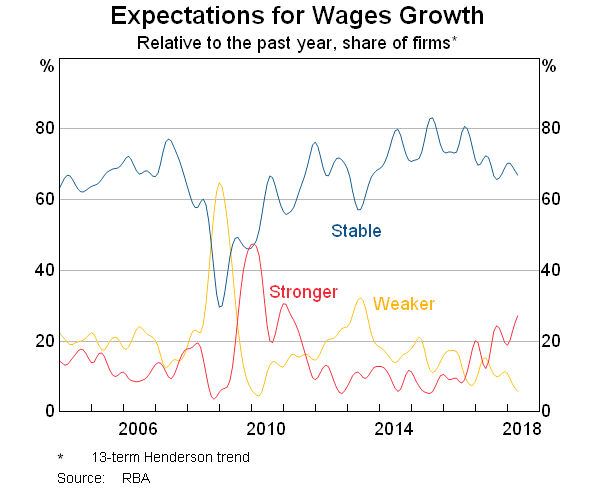
So it is reasonable to expect growth in wages to pick up from here. To repeat the point, though, this pick-up is expected to be only gradual given both the spare capacity that still exists in our labour market and the structural factors at work.
Productivity
This is an appropriate segue to the issue of productivity.
The best outcome is one in which a pick-up in wages growth is accompanied by stronger growth in labour productivity. That’s because, ultimately, the basis for sustained growth in real wages is that we become more productive as a nation.
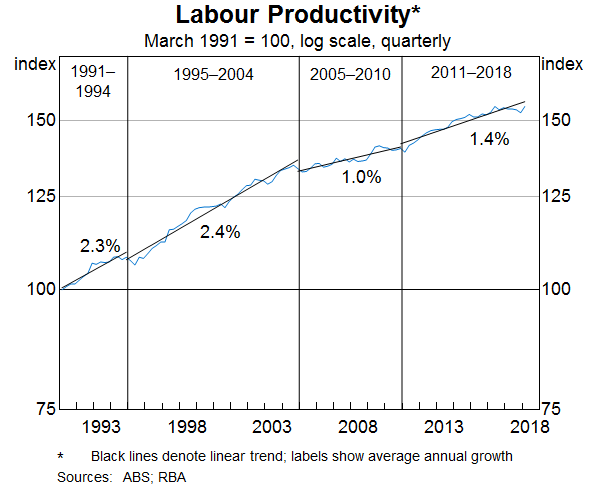
The recent productivity data are difficult to interpret. Despite a positive outcome in the most recent quarter, there has been no net increase in measured labour productivity over the past two years. Over the past couple of years, output growth has been subdued, but employment growth has been strong. In other words, measured labour productivity growth has been weak (Graph 9). However, if we take a slightly longer period – say since the end of 2010 – labour productivity growth has been better, averaging 1.4 per cent per year, which is a reasonable estimate of the rate of productivity growth we could expect over the medium term. This outcome has been boosted by stronger labour productivity in the mining sector as new production comes on stream after the investment boom. It may be that the current lull in productivity growth is just noise in the data, which is quite common, but it may also be a sign of something more persistent. Again, time will tell.
Graph 9
In trying to understand recent trends, it is useful to examine what has been happening in the broad industry groups: goods-related industries, business services and household services (Graph 10). Employment growth has been especially strong in household services over recent times, yet measured productivity growth in this area of the economy has been quite weak. Output per hour worked in this set of industries is only 4 per cent higher than it was in 2010. In contrast, over this period, output per hour worked is up 13 to 16 per cent in the other industry groups. This is quite a different picture.
Graph 10
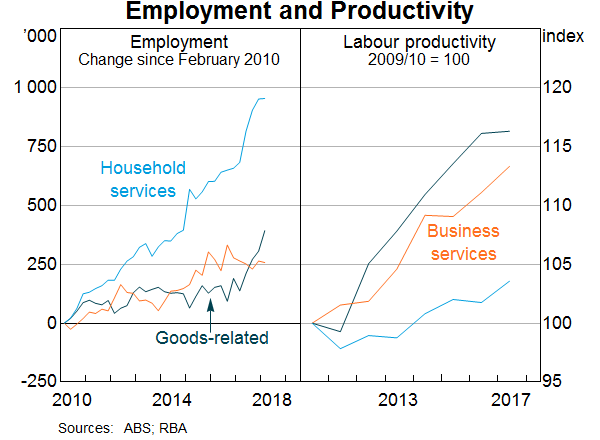
Almost 40 per cent of the workforce currently works in household services, so the weak productivity growth here is weighing on the outcome for the economy as a whole. It is possible that part of the story is the difficulty of measuring output in some service industries. Even so, last year’s ‘Shifting the Dial’ report by the Productivity Commission highlighted some of the steps we could take to boost productivity in the delivery of services.[2]
One of these steps is ensuring a strong ongoing focus on training, education and the accumulation of human capital. As I have spoken about on previous occasions, our national comparative advantage will increasingly be built on the quality of our ideas and our human capital. This means that a continued focus on education and research is important.
Investment in human capital also helps with two of the issues that I touched on earlier: the diffusion of new technologies and emerging skills shortages.
One explanation for the widening gap between leading and laggard firms is the difficulty of employing new technologies. Successfully using these technologies requires both the right management capability and technical skills. Both of these can be difficult to acquire. It seems reasonable, then, to suggest that investment in human capital can both lift the rate of technical progress and accelerate its diffusion. It is therefore an important part of addressing the slow wages growth in many advanced economies, including Australia. Another way of encouraging the more rapid diffusion of technology is ensuring that there is strong competition in our economy.
There are many other elements of the productivity debate that are also important. I don’t plan to expand on them today, but the list of areas is well known. It includes: the design of the tax system; the provision and pricing of infrastructure; the way we finance innovation and new businesses; and our business culture around innovation, risk and entrepreneurship. We need to keep all these areas on the radars of both government and business if we are to build on the prosperity that we currently enjoy.
Monetary Policy
I would like to close with a few words on monetary policy.
At its meeting last week, the Reserve Bank Board again held the cash rate steady at 1½ per cent, where it has been since August 2016.
Subsequent to the Board meeting, the national accounts provided confirmation that the Australian economy is moving in the right direction. If this continues to be the case, it is likely that the next move in interest rates will be up, not down. It is, however, important to remember that the environment in which interest rates are increasing is also likely to be one in which people’s incomes are growing more quickly than they are now. This will help.
Any increase in interest rates, however, still looks to be some time away. The Board will want to have reasonable confidence that inflation is picking up to be consistent with the medium-term target and that slack in the labour market is lessening. At this stage, a sustained pick-up in inflation to around the midpoint of the target range is likely to require faster wages growth than we are currently experiencing. There are reasonable grounds to expect that this increase in wages growth will occur. But for the reasons I have spoken about today, this increase is likely to be only gradual. Given this, there is not a strong case for a near-term adjustment in monetary policy.
With things moving in the right direction, the Board’s view is that by holding rates steady, we can help promote a sense of stability and confidence. We hope that this helps Australians make the decisions that can help build the future prosperity of the country that we are so fortunate to live in.
Thank you for listening. I am happy to answer your questions.
Endnotes
[*] I would like to thank Andrea Brischetto and Geoff Weir (a visiting scholar to the Reserve Bank) for assistance in the preparation of this talk.
[1] Andrews D, C Criscuolo and P Gal (2015), ‘Frontier Firms, Technology Diffusion and Public Policy: Micro Evidence from OECD Countries’, OECD Productivity Working Papers No 2. Available at <https://www.oecd.org/eco/growth/Frontier-Firms-Technology-Diffusion-and-Public-Policy-Micro-Evidence-from-OECD-Countries.pdf>.
[2] Productivity Commission (2017), ‘Shifting the Dial: 5 Year Productivity Review’, report No. 84, August. Available at <https://www.pc.gov.au/inquiries/completed/productivity-review/report/productivity-review.pdf>.


