GBP/USD drifts to 1.3100 by September 30, 2026 in the base case, 1.2800 in the bear case, and 1.3700 in the bull case. The base case rests on a firmer dollar — driven by US inflation running at double the UK rate and a Federal Reserve still flagging hikes — capping a sterling that lacks its own bullish spark.
GBP/USD reaches 1.3100 by the end of Q3 2026 in the base case. The anchor is an inflation gap that leaves the dollar with the larger hiking risk: US headline CPI sat at 4.2% in May 2026 against UK CPI of 2.8% (Bureau of Labor Statistics and Office for National Statistics, June 2026), even as both central banks hold near 3.75%. With the US Dollar Index back above 100 after the June 17 Fed hold, cable is capped rather than collapsing — and this analysis walks the rate-asymmetry mechanism, the case against, and the levels that would break the call.
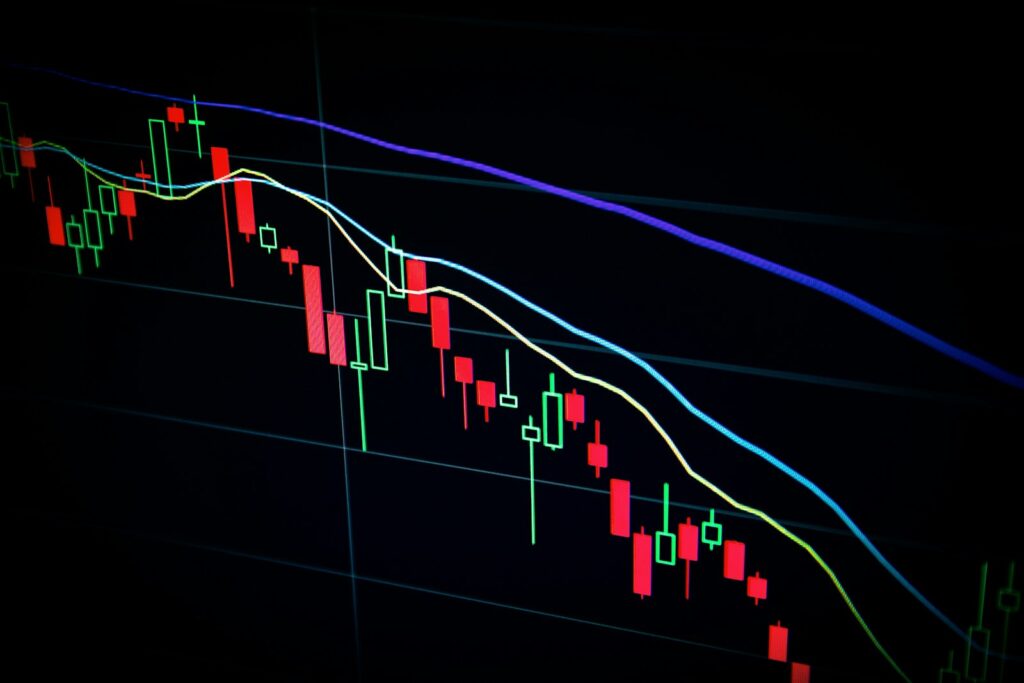
Key Levels:
• Asset: GBP/USD (cable), spot near 1.3400 at time of writing — market data, June 25, 2026
• Base case target: 1.3100 by September 30, 2026 — dollar-strength / inflation-asymmetry
• Bull case target: 1.3700 if the Fed holds through Q3 and the Bank of England hikes to 4.00% on sticky services inflation
• Bear case target: 1.2800 if the Fed hikes in July and risk-off returns
• Major support: 1.3150, then the 1.3000 round level — prior swing lows
• Major resistance: 1.3650 — top of the descending channel from the spring high
• Invalidation level: a weekly close above 1.3650 — methodology: channel break
Methodology
This call is built from official policy and inflation data through June 25, 2026: the Bank of England’s June 2026 Monetary Policy Committee minutes, the Federal Reserve’s June 17 statement and updated projections, May CPI releases from the Bureau of Labor Statistics and the Office for National Statistics, and the US Dollar Index spot reading. Positioning context draws on published sell-side FX research. The window is the third quarter of 2026, anchored on the July 29 FOMC and the July 30 BOE meeting. Caveats: cable is heavily a dollar story, so US data dominates the path, and a single hot or cold US CPI print can move the pair more than any UK development.
The data: a near-level rate gap, an uneven inflation risk
The headline rate gap is almost closed — the Fed holds at 3.50–3.75% and the BOE at 3.75% — but the risk around each is asymmetric. US inflation at 4.2% is running well above the UK’s 2.8%, and the Fed’s June projections showed nine of 18 members pencilling in at least one 2026 hike. The BOE held 7–2 on June 17–18, with two members voting for an immediate rise to 4.00%. Both committees lean hawkish; the dollar simply has the hotter inflation print behind it.
| Metric | United States | United Kingdom |
|---|---|---|
| Policy rate | 3.50–3.75% | 3.75% |
| Headline CPI (May 2026) | 4.2% | 2.8% |
| Core / services inflation | core 2.9% | services 3.7% |
| June decision | Hold; 9/18 dots see a hike | Hold 7–2; 2 voted for 4.00% |
| Next meeting | July 29 FOMC | July 30 MPC (MPR) |
Sources: Federal Reserve June 17, 2026 statement and SEP; Bank of England June 2026 MPC minutes; BLS and ONS May 2026 CPI. Time window: data through June 25, 2026.
Will GBP/USD fall in 2026? On the base case, modestly — toward 1.3100 by the end of September, not a collapse. Cable trades near 1.3400 in late June 2026, and the move lower is a function of dollar firmness rather than sterling weakness: the pound has held up against the euro and only looks soft against a dollar that has repriced the Fed’s hiking risk higher. Major-bank year-end targets cluster at 1.36–1.40, but several of those calls assumed Fed cuts that have since been pushed back. With US CPI at 4.2% and the Dollar Index back above 100, the path of least resistance through Q3 is a grind lower in cable, bounded by firm support around 1.3150.
“We no longer expect broad Dollar depreciation, even on a 6- or 12-month horizon. The Dollar will be Stronger for Longer.”
— Kamakshya Trivedi, Chief FX and EM Strategist, Goldman Sachs (Goldman Sachs)
The mechanism: dollar firmness caps a spark-less pound
The base case works through three channels. First, inflation asymmetry: with US CPI at 4.2% against the UK’s 2.8%, the market prices a fatter tail of Fed tightening than BOE tightening, and rate-risk repricing is what moves spot when the headline gap is flat. Second, the safe-haven bid: the US–Iran ceasefire has eased energy prices, but they remain above pre-conflict levels and volatile, and any re-escalation pushes the dollar up and cable down. Third, the absence of an independent sterling catalyst — UK growth is soft and fiscal policy is tightening, so the pound tends to track EUR/USD rather than lead.
Why is the pound capped against the dollar? Because sterling lacks a self-driven bullish story while the dollar has a clear one. UK services inflation at 3.7% keeps the BOE from cutting, which supports the pound at the margin, but it does not give cable an upside engine. Meanwhile the dollar enjoys the higher inflation print, the hawkish Fed dot plot, and a safe-haven role whenever Middle-East risk flares. Goldman Sachs frames sterling as tethered to the euro without an independent spark, with UK growth slowdowns and fiscal drag capping gains even on dollar-soft days. The result is a pair that struggles to clear 1.3650 and leans toward the low-1.30s while the dollar holds its bid.
The opposing view deserves weight: if UK services inflation forces the BOE to hike to 4.00% before the Fed moves, the rate gap swings toward sterling and the call inverts.
What the model misses
The framework’s largest blind spot is that it treats cable as a dollar derivative, which understates UK-specific shocks. A credible fiscal consolidation at the autumn Budget, a sharp drop in UK services inflation, or a disorderly move in Gilts could all move sterling independently of the dollar. History is a caution here: in 2022 the pound’s path was dominated by domestic fiscal events, not the Fed. The model also assumes the energy truce holds; a renewed Gulf shock would lift both the dollar and UK inflation at once, muddying the rate-asymmetry signal the call relies on.
“Upside risks to the lasting achievement of the 2% inflation target have increased in recent months on account of events in the Gulf and their implications for commodity prices and supply chains. Recognising the significant uncertainty that surrounds the UK inflation outlook, raising Bank Rate to 4% continues to be the most robust monetary policy response.”
— Huw Pill, Chief Economist, Bank of England (Bank of England)
What would invalidate this call
The base case to 1.3100 breaks if ANY ONE of these four signals fires:
- GBP/USD posts a weekly close above 1.3650. That clears the descending channel from the spring high and signals the dollar bid has rolled over.
- US CPI cools back below 3.5%. The thesis leans on a 4.2% US print; a cooler number removes the Fed-hike premium that is firming the dollar.
- The Fed cuts or turns dovish at the July 29 FOMC. A dovish pivot collapses the dollar leg directly and would lift cable.
- The BOE hikes to 4.00% on July 30 while the Fed holds. A rate gap that swings toward sterling is the bull case and inverts the call.
What to watch next
The two decisive dates are back-to-back: the July 29 FOMC and the July 30 BOE meeting, the latter a Super Thursday with a fresh Monetary Policy Report and press conference. Between now and then, the June US CPI release is the single most important input for the dollar leg, and UK services inflation is the figure most likely to move the pound. On the chart, 1.3150 support and the 1.3650 channel cap are the levels that define the range.
TL;DR
GBP/USD trades near 1.3400 in late June 2026 and the base case sees it drift to 1.3100 by September 30, with a 1.2800 bear case and a 1.3700 bull case. The driver is dollar firmness, not sterling weakness: US CPI at 4.2% versus the UK’s 2.8% (BLS and ONS, June 2026) hands the dollar the larger hiking risk even with both rates near 3.75%. The call breaks on a weekly close above 1.3650, a sub-3.5% US CPI print, a dovish July Fed, or a BOE hike to 4.00%.
FAQ
What is the GBP/USD forecast for Q3 2026?
The base case is 1.3100 by September 30, 2026, from near 1.3400 in late June. The bear case is 1.2800 on a July Fed hike and risk-off; the bull case is 1.3700 if the BOE hikes to 4.00% while the Fed holds.
Why is the pound falling against the dollar?
It is mostly dollar strength, not sterling weakness. US inflation at 4.2% is double the UK’s 2.8%, giving the Fed the larger hiking risk and the dollar the firmer bid even though both policy rates sit near 3.75%.
Where are the key GBP/USD levels?
Support sits at 1.3150 and the 1.3000 round level; resistance is the 1.3650 channel cap. A weekly close above 1.3650 would invalidate the bearish base case.
What could push GBP/USD higher?
A cooler US CPI print, a dovish July Fed, or a Bank of England hike to 4.00% driven by services inflation at 3.7% would all support cable and threaten the call.
For related dollar coverage, see our DXY to 102 thesis, the EUR/USD capped-near-1.16 call, and our USD/CAD rate-gap analysis.
This article is informational analysis only and is not financial, investment, or trading advice. Foreign-exchange, commodity, and equity markets are highly volatile and can lose substantial value rapidly. Leveraged products carry total-loss risk and may exceed the initial margin posted. Past performance and historical correlations do not guarantee future results. Do your own research and consult a regulated financial adviser before making any investment decision.
Abdelaziz Fathi
Abdelaziz Fathi covers the intersection of forex/CFD brokerage, regulation, liquidity, fintech, and digital assets. With a B.A. in Finance and hands-on industry exposure, Aziz blends analytical rigor with clear storytelling to make complex market structure understandable for traders, brokers, and fintech professionals.
