By Giles Coghlan, Chief Currency Analyst, HYCM
In June, Google searches for the word “recession” peaked at their highest level since March 2020. The only other notable peak since 2017 was August of 2019, which was also the last time – prior to March of this year – that the US 2-year/10-year yield curve inverted.
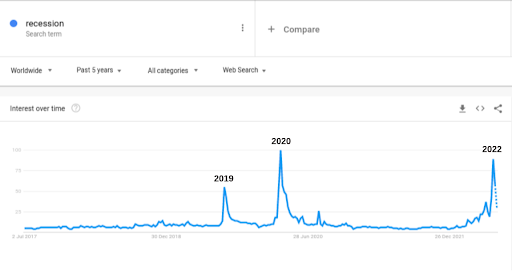
2019
You may also recall that 2019 was the last time the Federal Reserve attempted to raise rates and that much of the market commentary at the time surrounded the issue of whether Powell was raising rates into a recession. Fed policy found Powell in direct conflict with President Trump, who was waging his trade war with China and wanted the Fed to cut rates to zero rather than hiking.
2020
Markets never got an answer to who was right or to whether Powell’s tightening would hasten a recession. By January of 2020, we started hearing about a new virus that had escaped a Wuhan market, which accounts for the second and highest peak on the above chart.
2022
Today, Powell finds himself with the same tools at his disposal but in a completely different macroeconomic and geopolitical environment. Whether or not he’s hiking into a recession, he actually does have very real inflationary pressures to contend with. That’s what’s qualitatively different about this post-pandemic reality.
Moderating Demand
Indeed, in his recent testimony before congress he persistently, and some might say ‘stubbornly’, returns to the issue of demand; of bringing it back into alignment with supply, of moderating it, of it being out of balance with supply, of there being a mismatch between them.
And again at the recent 2022 ECB Forum on Central Banking, he reiterated the Fed’s aim to have moderate growth so that supply can catch up, that it’s a necessary adjustment that needs to happen, that supply and demand are out of balance in many areas of the US economy, and that bringing them back into better balance will bring inflation down to the Fed’s long-term 2% target.
Historical Lag
But if the Fed was slow to identify inflation as a persistent issue in the first place, how do we know it won’t be slow to identify the effects of this hawkish pivot? 2021 was all about the gradual realisation that inflation was not in fact transitory, like the lulls in the above chart where recession searches are at their lows.
If you remember, it was the rampant inflation in commodity prices, particularly the industrial metals like copper, that initially raised the inflationary alarm, an alarm that the Federal Reserve was unwilling to heed at the time.
Looking at that same area of the commodity complex today, we see it in full bear mode. The Dow Jones Commodity Index for Industrial Metals hit lows on June 24 last seen in August of 2021. This doesn’t just put this sector of the commodity complex in a bear market now, it initially hit bear market conditions in May.
Narrowing in on Copper and Aluminium specifically, these two industrial metals are currently at levels last seen in February and June of 2021, respectively. Aluminium entered a bear market back in April of this year and didn’t look back. Aluminium futures are currently down almost 40% from their February highs.
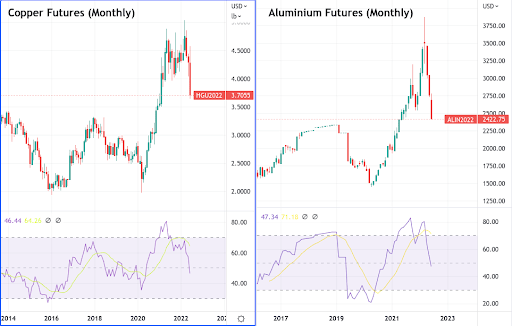
Copper narrowly escaped the traditional 20% down bear market designation in May, only to officially enter into one in June of this year. Copper futures are currently trading roughly 26% off their March peak.
On the monthly chart, copper and aluminium futures are currently 10% and 3% away from their pre-pandemic highs, respectively.
Final Thoughts
The Google Trends chart is worth considering because Google searches are a notoriously lagging indicator. This is necessarily so because peaks in searches mean that interest in learning what others are saying about a term is peaking, in this case, “recession”. So, a peak represents a sort of consensus of concern or interest forming. In other words, crowds usually become maximally interested in a phenomenon when it’s just about over.
The peak in searches for the word ‘recession’ in March of 2020 coincided with the COVID bottom in the S&P 500. Going even further back, searches for ‘recession’ also repeatedly peaked between October 2008 and February of 2009, which not only captures the capitulation moment and bottom formation in the S&P 500 after the Great Financial Crisis, but also the period where it dropped below the 200-month moving average. That’s certainly food for thought.
Metals like copper and aluminium, and indices like S&P500 are available for trading at HYCM, as well as other instruments.
Note: Cryptocurrencies are not available for trading under HYCM (Europe) Ltd and HYCM Capital Markets (UK) Limited.
About: HYCM is the global brand name of HYCM Capital Markets (UK) Limited, HYCM (Europe) Ltd, HYCM Capital Markets (DIFC) Ltd, HYCM Ltd and HYCM Limited, all individual entities under HYCM Capital Markets Group, a global corporation operating in Asia, Europe, and the Middle East.
High-Risk Investment Warning: Contracts for Difference (‘CFDs’) are complex financial products that are traded on margin. Trading CFDs carries a high degree of risk. It is possible to lose all your capital. These products may not be suitable for everyone and you should ensure that you understand the risks involved. Seek independent expert advice if necessary and speculate only with funds that you can afford to lose. Please think carefully whether such trading suits you, taking into consideration all the relevant circumstances as well as your personal resources. We do not recommend clients post their entire account balance to meet margin requirements. Clients can minimise their level of exposure by requesting a change in leverage limit. For more information please refer to HYCM’s Risk Disclosure.
