Asian stock indices finished mostly higher today amid conflicting headlines from trade talks between China and the USA after the US House of Representatives voted two legislations backing protesters in Hong Kong. The Hang Seng index is 0.19% higher at 26,517.
The Singapore FTSE Straits Times Index ended 0.67% higher at 3,213, while the Shanghai Composite is 0.64% lower at 2,884. Nikkei 225 ended 0.40% higher at 23,131. The ASX 200 in Australia added 0.55% higher at 6,709.
European indices started the day on a positive foot, DAX trading 0.16% higher at 13,159, CAC40 is 0.22 per cent higher at 5,893 while the FTSE MIB in Milan is 0.24 per cent higher at 23,336. In London, FTSE 100 is trading 0.93% higher at 7,306.
In commodities, crude oil trades 0.77 per cent lower at $58.13 as OPEC may cut crude oil output until June 2020. Brent oil is trading 0.70% lower at $63.52 per barrel as crude oil world demand will be affected by the global growth slowdown. Gold trades lower at 1,465, as the short term momentum is bearish now after the gold price trades below the 50 and 100-day moving average. On the upside, resistance stands at 1,555.13 YTD high, while support is at 1,448 the recent low.
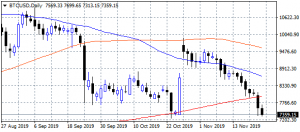
In cryptocurrencies, Bitcoin (BTCUSD) trades lower for one more day at 7,527, hitting the daily low at 7,497 and the daily high at 7,674. BTCUSD momentum is bearish now as the cryptocurrency trades below the 50 and 200-day moving averages. First support for bitcoin stands now at $7,364 recent low, while the next support stands at 7,300 round figure.
On the upside, resistance stands at 9,925 recent high and then at 10,000 round figure. Ethereum – ETHUSD trades lower at 157.87 with capitalisation now to 17.36 billion, immediate resistance for ETH stands at 200 recent high while the support stands at 136 the low from May 6th, LTCUSD trades lower at 50.55. The crypto market capitalization has dropped to $207.06 billion.
In the Lookout: Japan Jibun Bank Manufacturing PMI came in at 48.6 below forecasts of 48.7 in November. Japan National Consumer Price Index (YoY) came in at 0.2% below forecasts of 0.3% in October.
Australia Commonwealth Bank Services PMI came in at 49.5, below expectations (53.5) in November.
Australia Commonwealth Bank Manufacturing PMI registered in at 49.9, above expectations of 49.8 in November, Composite PMI dipped from previous 50 to 49.5 in November
The central bank of China (PBOC) set the Yuan rate (USDCNH) at 7.0306 versus yesterday’s settlement at 7.0030.
Trading Perspective: In fx markets, USD index trades 0.06 per cent lower at 97.90, the AUDUSD trades 0.02 per cent higher at 0.6787, while NZDUSD trades 0.09% higher at 0.6408. USDCHF IS 0.03% higher at 0.9937.
GBPUSD trades 0.16% higher at 1.2925 as we are getting closer to the Brexit deadline on January 31st, 2020. Support for the pair now stands at 1.2578 recent low, which, if broken, might accelerate the slide further towards 1.20. On the upside, first resistance will be met at 1.3010 recent high while more offers will emerge at 1.3050 round figure.
In Pound futures contracts markets, open interest increased by 2,400 contracts, while the volume increased by around 11.500 contracts.
EURUSD trades 0.12% higher at 1.1072 as the pair’s momentum has turned positive. Immediate resistance for the common currency stands at 1.1172 recent high. On the downside, the first support stands at 1.1056 today’s low and then at 1.1003.
In euro futures markets open interest decreased by 135 contracts, the volume decreased by around 11.300 futures contracts.
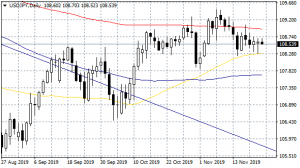
USDJPY is trading 0.01% lower at 108.60, having hit the daily low at 108.56 and the daily high at 108.70. USDJPY pair will find support at 104.44 the low from August 23rd. On the upside, resistance for the USDJPY now stands at 109.06 recent high.
In Yen futures markets, open interest increased by 396 contracts, and volume decreased by around 7,400 futures contracts.
USDCAD is trading 0.02% lower at 1.3282. The pair will find support at 1.3017 the yearly low while extra support stands at 1.30 round figure. On the upside, resistance will be met at the 1.3356 high from September 3rd before an attempt to 1.3450, high from 31st May.