 Key Takeaways: Both volatility and the variance of volatility across securities have risen substantially since late February. Trading desks should incorporate intraday volatility metrics in their pre-trade and post-trade TCA. Particularly where this is used to determine auto-routing eligibility. Algo wheel analysis should be “reset” from the end of February and the implication for weightings carefully considered.
Analysis:
At FlexTrade, two of the questions we most often hear from our clients about automated trading and algo wheels are:

Alistair Cree
- “How should I determine which orders can be auto-routed?”
- “How many orders do I need in order to accurately evaluate the performance of my algo wheel destinations?”
The recent crisis with the global pandemic, and the corresponding shift in the market regime in US equities underscores one important metric to consider when answering both of these questions – intraday volatility. Figure 1 shows a comparison of the relative changes in FlexTrade’s proprietary intraday volatility metric (based on the variance of intraday returns) versus a more traditional 60-day volatility metric (based on the standard deviation of close-on-close returns). We’ve used the symbol SPY as an example, but similar trends hold across US equities.
Intraday and 60-Day Volatility in SPY
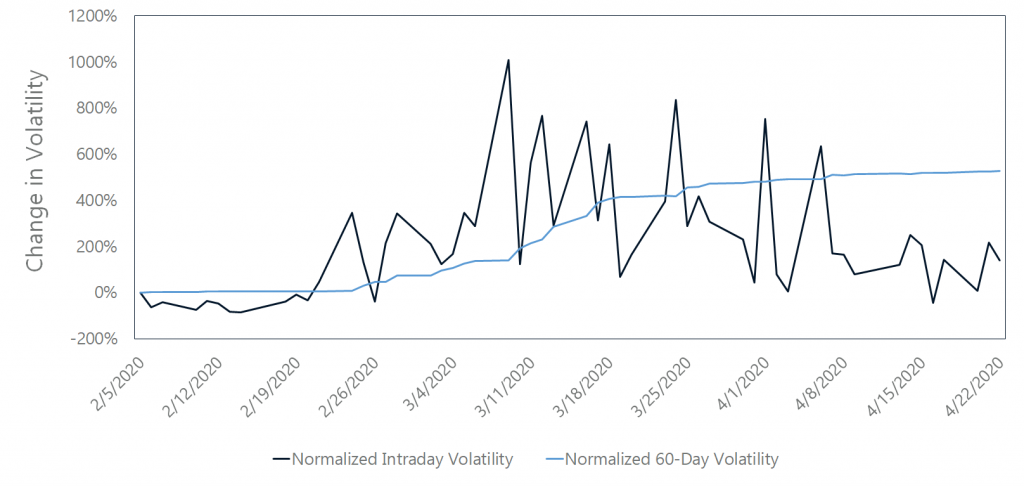
Figure 1. Comparison of the relative change in intraday and 60-day volatility metrics in SPY since 02/07/2020.
As can be clearly seen:
- The intraday volatility metric responds to the regime much more rapidly than the historic measure.
- Looking at the intraday volatility, the US equity markets entered a period of sustained heightened volatility at the end of February.
- Since the onset of the crisis, relative day-to-day variations in volatility have also increased significantly. The difference between a high and a low volatility day is much greater in the post-COVID-19 world.
In addition to these timeseries trends, volatility now varies much more significantly across securities. Figure 2 shows the relative change in the standard deviations of intraday and historic volatility across S&P 500 securities. Within any single day, the difference between high and low volatility securities have grown substantially.
Standard Deviation in Intraday and 60-Day Volatility within the S&P 500
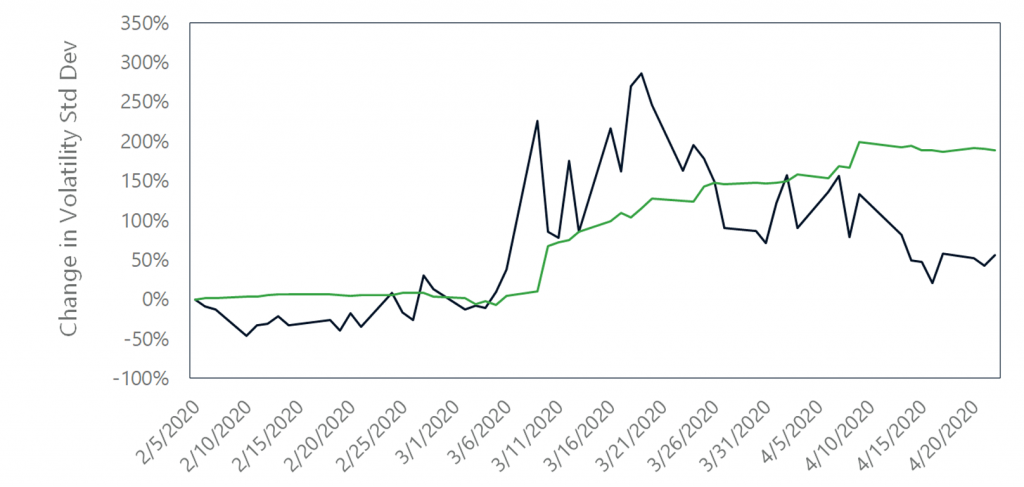
Figure 2 – Comparison of the relative change in the standard deviation across US equities, of intraday and 60-day volatility metrics since 02/07/2020
Conclusions:
Combined these two trends confirm the entry into a new volatility regime at the end of February in which volatility is both substantially higher and more variable across days and securities. This has a number of implications for traders and trading quants, but in our capacity as an EMS, algo wheel, and TCA provider we recommend that there are two points worth emphasizing:
- Intraday volatility is a substantially more important metric in this new regime. As the global health and economic situation evolves, more sudden shifts in overall volatility are likely, and historic volatility metrics will be slow to respond to such events. Consequently, trading desks should look to incorporate intraday volatility within pre-trade and post-trade TCA, and as a factor in decision making related to order difficulty.
- The shift in volatility regimes may have substantially affected the behavior and performance of different algo strategies. (Consider, for example, the effect of increased volatility on the behavioral impact of limit prices). As a result, data gathered from before the crisis will likely be less helpful in forecasting the future relative performance of different algos. Consequently, it’s advisable to revert algo wheel weighting towards a more even distribution to gather better data on the relative performance of algos under these new conditions.