Asian stocks finished higher close to nine months highs, as investors sentiment was supported by strong Chinese industrial production numbers and better GDP data. In Japan, the Nikkei225 main index added 0.25 percent to 22,277, the highest since December 4th, 2018. The Hang Seng benchmark in Hong Kong finished 0.02 percent higher at 30,109. Chinese stocks also finished higher, with Shanghai Composite finishing 0.33 percent higher at 3,264, and in Singapore, the FTSE Straits Times index finished 0.45 percent higher at 3,347. Australian equities submitted to sellers and ASX 200 index ended lower by 12 points or 0.2%. The ASX 200 continues to trade on lighter volumes with school holidays and the Easter long weekend coming up.
In commodities markets, Crude oil continues north after a two-day consolidation at five months high, the black gold as of writing trades at 64.48 boosted by OPEC’s ongoing supply cuts, geopolitical uncertainty and the US additional sanctions on Iran. During the weekend, Russia’s Finance Minister Anton Siluanov said that Russia and OPEC might decide to boost production to fight for market share with the United States. On Friday, the weekly release of the Baker Hughes US rig counts showed a decline of 3 rigs giving 1022 figure for the week ended on April 12. The near-term upside target for black gold is at the 65.00 figure, but I expect some profit taking to prevail as oil has reached overbought levels, the RSI trading above 70. Brent oil is also adding to its gains and trades today at $71.94/barrel. Gold’s negative momentum is still intact hitting yesterday 1273 figure, the lowest levels since April 3rd just to start a mild rebound during the Asian session to $1279. XAUUSD’s technical picture is negative and now strong support stands at the 200-day moving average down to $1250, which if broken can accelerate the downward move to 1200 as sellers are in full control. Strong resistance now stands at the $1300 round figure and then at the 50-day moving average around $1305.
The European session started mixed, tracking after sentiment supported by influential Chinese macro figures. DAX30 is 0.06 percent higher to 12,108, CAC40 is 0.01 percent higher at 5,524 while FTSE100 in London is 0.02 percent higher at 7,458, and the FTSE MIB in Milan is trading 0.07 percent higher at 21,934.
In cryptocurrencies market, Bitcoin (BTCUSD) continues its up and down around the key 200-day moving average at $5,153, currently trading at $5,200, making the daily low at 5,167 and daily high at 5,267. BTCUSD finds yesterday strong support at the $5,000 level and started the rebound from that figure. Bitcoin will find support at the 50-day moving average at 4,089. Ethereum (ETHUSD) also trades higher to 165, and it is placed nicely above the 100-day moving average facing strong resistance at 193, the 200-day moving average, while Litecoin (LTCUSD) also follows higher at 79.40. The cryptocurrencies market cap currently holds above $160.0B.
On the Lookout: China supplied today some strong figures, the industrial production rose 8.5% y/y (cf. 5.9%), the retail sales were up 8.7% y/y (cf. 8.4%) and last but not least, Chinese GDP rose 6.4% slightly above analyst’s forecasts.
Fitch Ratings in its latest review on the New Zealand economy, reports that Capital proposals are unlikely to affect New Zealand’s major bank franchises. High household debt in New Zealand is broadly stable but is a key risk. Expect modest deterioration in asset quality in New Zealand over the next year, in part because impaired loan levels are around historical lows. The banks’ strong domestic franchises allow for a stable business model that helps offset continued high macroeconomic risks in New Zealand.
In Japan, the trade data for March showing its exports fell 2.4% from a year earlier, while the trade surplus sank 33%.
In the macro calendar from the Americas today, we have the Canadian manufacturing sales at 12:30GMT, followed by the US capacity utilization and industrial figures due at 13:15GMT. New Zealand’s GDT price index data will be published around 14:00GMT. Oil traders will await the release of the US API weekly crude stocks data that will be released at 2030GMT.
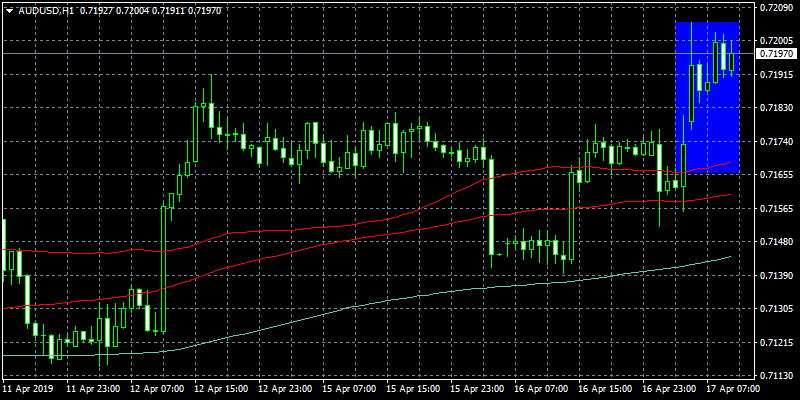
Trading Perspective: In Forex markets, the US dollar is trapped between 96.40 and 96.65, while AUDUSD after yesterdays pullback continues higher adding 0.24 percent to 0.7192 as RBA April meeting’s minutes was widely read as dovish, and the likelihood of near term rate hike is low. The pair needs to break convincingly above the 200-day higher to establish a long term positive momentum. Kiwi underperforms and trades 30 pips lower at 0.6736.
GBPUSD: The pair trades lower as the pair’s volatility is at a monthly low, losing the short term momentum as it trades at 1.3050 below the 200-hour moving average. On the downside, major support will be found at 1.2975 at the 200-day moving average while solid protection can be found at the 100-day moving average around 1.2942. On the flipside, immediate resistance stands at 1.3195, the high from previous week session, and from there major resistance can be found at 1.3232 while 1.3382, the yearly high, will be met with strong supply.
In GBP futures markets, open interest shrunk by nearly 1.9K contracts on Tuesday from Monday’s final 151,327 contracts, according to flash data from CME Group. On the other hand, the volume went up by almost 32.7K contracts, reversing the previous drop.
EURUSD managed to rebound from yesterday lows at 1.1280 and regains the 1.13 level. The pair made the Asian high at 1.1316 and the low at 1.1280. Euro holds above the 50-day moving average and now is targeting the 100 DMA at 1.1345. Immediate support can be found at the 50-hour moving average around 1.13, and further bids will emerge at 1.1293 and the 100-hour moving average.
EURO remains in negative mood following recent poor figures in Eurozone. In fact, recent disappointing readings in the region somehow confirm that the slowdown in the bloc and the ‘patient-for-longer’ stance from the ECB could be among us for longer than expected.
In Euro futures markets, open interest rose by nearly 3.8K contracts on Tuesday. Volume extended the choppy performance and increased by almost 68.8K contracts.
USDJPY: Same story here as the pair is trading in just 20 pips trading range, having hit the low at 111.91 and the high at 112.15. Major support for the pair stands at 111.51 the 200-day moving average and then at 111 round figure if the pair manages to break below the 100-day simple moving average at 111.10. Immediate resistance for the pair stands at 112.10 the March 2019 high.
Open interest in JPY futures markets increased by 6.9K contracts on Tuesday, recording at the same time the fifth consecutive build. In the same direction, volume partially reverted Monday’s pullback and increased by more than 11K contracts.
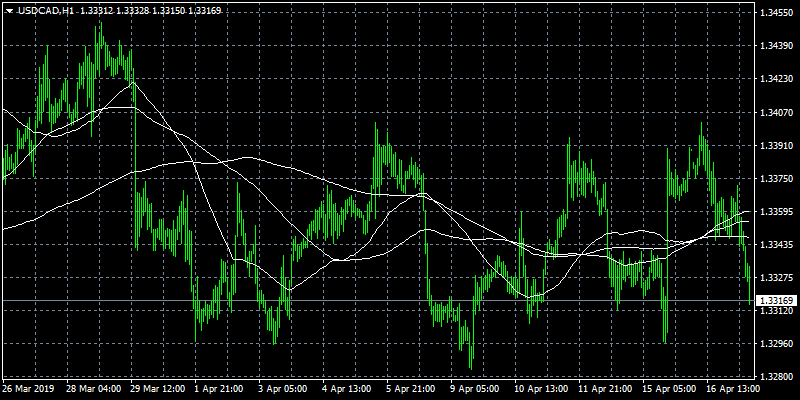
USDCAD did the opposite move from yesterday, as it retreats from yesterdays high at 1.3381 to 1.3328 as oil prices continue higher. The pair will find immediate support at the 100-day moving average around 1.3315 while extra support stands at 1.3196 and the 200-day moving average which if breached will drive prices down to the 1.31 key support. On the upside, immediate resistance stands at 1.34, a break of which can escalate the rebound towards 1.3430.