Asian stock indices finished higher at the first trading session of the week as optimism returns to equity markets that a trade deal might still happen by the end of the year. US House of Representatives last week voted two legislations backing protesters in Hong Kong a move that complicates the negotiations.
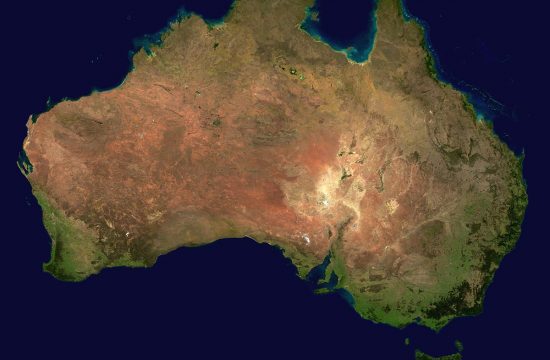
The Hang Seng index is 1.66% higher at 27,036. Nikkei 225 ended 0.78% higher at 23,292. The Singapore FTSE Straits Times Index ended 0.18% higher at 3,231 while the Shanghai Composite is 0.60% higher at 2,902. The ASX 200 in Australia added 0.58% higher at 6,748.
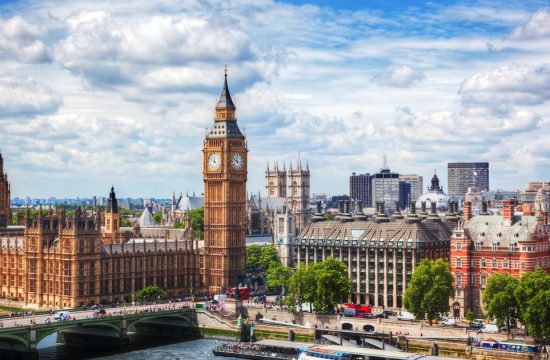
European indices also started the week higher on a positive foot, DAX trading 0.47% higher at 13,225, CAC40 is 0.55 per cent higher at 5,925 while the FTSE MIB in Milan is 0.04 per cent higher at 23,446. In London, FTSE 100 is trading 0.65% higher at 7,374.
In commodities, crude oil trades 0.33 per cent higher at $57.96 as OPEC may cut crude oil output until June 2020. Brent oil is trading 0.38% higher at $62.61 per barrel as crude oil world demand will be affected by the global growth slowdown. Gold trades lower at 1,457, as the short term momentum is bearish now after the gold price trades below the 50 and 100-day moving average. On the upside, resistance stands at 1,555.13 YTD high, while support is at 1,448 the recent low.
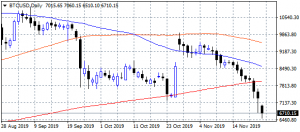
In cryptocurrencies, Bitcoin (BTCUSD) trades lower close to six-month lows at 6,579, hitting the daily low at 6,510 and the daily high at 7,060. BTCUSD momentum is bearish now as the cryptocurrency trades below the 50 and 200-day moving averages. First support for bitcoin stands now at $6,510 recent low, while the next support stands at 6,000 round figure.
On the upside, resistance stands at 9,925 recent high and then at 10,000 round figure. Ethereum – ETHUSD trades lower at 132.50 with capitalisation now to 14.63 billion, immediate resistance for Ethereum stands at 200 recent high while the support stands at 130 daily low, Litecoin trades lower at 42.38. The crypto market capitalization has dropped to $181.13 billion.
In the Lookout: Japan Coincident Index came in at 101.1 above expectations of 101 in September. The Japan Leading Economic Index came in at 91.9, below forecasts of 92.2 in September.
The Singapore Consumer Price Index (YoY) came in at 0.4, below forecasts of 0.5 in October.
The central bank of China (PBOC) set the Yuan rate (USDCNH) at 7.0397 versus yesterday’s settlement at 7.0306.
Trading Perspective: In fx markets, USD index trades 0.01 per cent lower at 98.26, the Aussie trades 0.21 per cent higher at 0.6795, while NZDUSD trades 0.29% higher at 0.6420. USDCHF is 0.01% higher at 0.9971.
GBPUSD trades 0.15% higher at 1.2848 as we are getting closer to the Brexit deadline on January 31st, 2020. Support for the pair now stands at 1.2578 recent low which if broken, might accelerate the slide further towards 1.20. On the upside, immediate resistance will be met at 1.3010 recent high, while more offers will emerge at 1.3050 round figure.
In Pound futures contracts markets, open interest increased by 2,400 contracts, while the volume increased by around 11.500 contracts.
EURUSD trades 0.06% higher at 1.1024 as the pair’s momentum has turned neutral for the short term. The first resistance for the euro stands at 1.1172 recent high. On the downside, the first support stands at 1.1015 today’s low and then at 1.1003.
In euro futures markets, open interest increased by 1,500 contracts, and the volume increased by around 19.100 futures contracts.
USDJPY is trading 0.21% higher at 108.86, having hit the daily low at 108.60 and the daily high at 108.88. USDJPY pair will find support at 104.44 the low from August 23rd. On the upside, resistance for the USDJPY now stands at 109.06 recent high.
In Yen futures markets, open interest increased by 396 contracts, volume decreased by around 7,400 futures contracts.
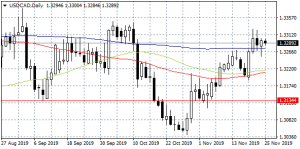
USDCAD is trading 0.02% lower at 1.3293, and the pair will find support at 1.3017 the yearly low while extra support stands at 1.30 round figure. On the upside, resistance will be met at the 1.3356 high from September 3rd before an attempt to 1.3450 high from 31st May.