Summary: The Australian Dollar’s star came tumbling down to earth as markets reversed risk sentiment sharply lower. Other risk currencies, the Kiwi, Canadian Loonie as well as Asian and EMS were not far behind. Sterling and the Euro reversed their gains on the broad-based US Dollar strength. An increase in coronavirus cases in the US were reported by Florida, Texas and Arizona. The World Health Organisation said that the persistent rise of Covid-19 cases in Latin America is cause for concern. Yesterday Fed Chair Jerome Powell warned that the US faces a long road to recovery. Wall Street stocks plunged, losing over 5% the worst one-day drop in percentage terms in nearly 3 months. The Aussie Dollar tanked 1.65% to 0.6850 from 0.7000. Against the Canadian Loonie, the US Dollar soared to 1.3630 from 1.3410, gaining 1.48%. Oil prices declined sharply. Brent Crude sank 8.6% to USD 38.45 (USD 41.30 yesterday). The Euro tumbled 0.61% to 1.1295 (1.1375), reversing its overbought condition. Sterling slumped 0.90% to 1.2595 (1.2747). The Japanese Yen and Swiss Franc, both haven-sought currencies rallied against the Greenback. The USD/JPY pair slipped to one-month lows at 106.573 overnight before settling at 106.85 (107.15 yesterday). USD/CHF dropped to a 3-month low at 0.93762 before rallying in late New York to 0.9442 (0.9437 yesterday). Emerging Market Currencies were markedly weaker against the Greenback. The USD/ZAR (US Dollar- South African Rand) pair jumped 3.86% to 17.1700 from 16.5300. Against the Singapore Dollar, the Greenback soared to 1.3925 from 1.3835.
Global bond yields tumbled. The benchmark US 10-year treasury rate fell 6 basis points to 0.67%. Germany’s 10-year Bund yield finished at -0.42% from -0.33% yesterday.
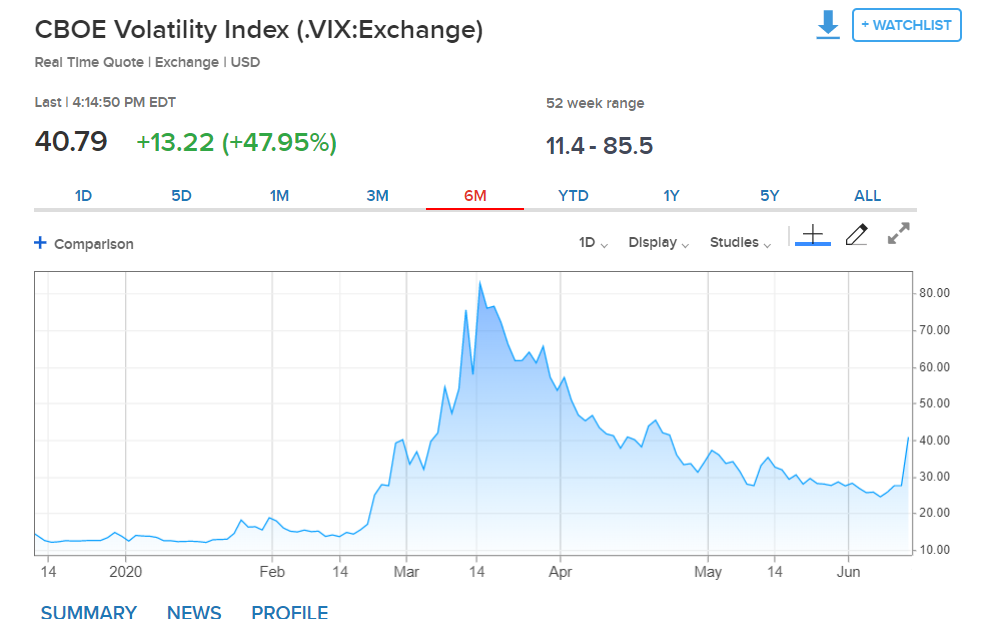
Wall Street stocks were sharply lower. The DOW plunged 6.4% to 25,237 (26,973) at the New York close. The S&P 500 lost 5.3% to 3,018 (3,188). The CBOE VIX (Volatility Index) jumped 47.95% to finish at 40.79 from 27.57 yesterday.
Yesterday’s data releases saw the UK’s RICS House Price Balance slump to -32% from -22%, missing forecasts at -24%. US Headline PPI in May rose to 0.4%, beating expectations of 0.1%. Core PPI matched forecasts with a -0.1% print. Claims for Unemployment benefits in the US for last week dropped to 1.542 million from an upwardly revised 1.897 million (from 1.877 million), beating forecasts at 1.550 million.
On the Lookout: Its back to monitoring the latest Covid-19 count as the reality of a second wave of cases emerge. Florida and Texas reported large single day increases in Covid-19 since the outbreak started. Not just in the U.S. but around the globe. The toll of cases in South America and some Asian countries like India from the coronavirus continues to rise. Risk appetite got smacked after the US Federal Reserve warned yesterday that if a second wave does happen, it would hamper the economy. Reuters reported that while the number of Americans filing for unemployment benefits fell last week, “millions laid off due to Covid-19 continue to receive unemployment checks, suggesting the US labour market could take years to heal even as hiring resumes.”
Today’s data calendar, while relatively light, saw New Zealand’s BusinessNZ Manufacturing Index climb to 39.7 in May from 25.9. Japan’s Revised Industrial Production follows. The UK reports on its May GDP, Manufacturing Production, Construction Output, Goods Trade Balance, Industrial Production and Consumer Inflation Expectations. Europe sees French Final CPI (May) and the Eurozone Industrial Production. Canada reports on its Capacity Utilisation Rate. The US reports its Import Prices and University of Michigan Consumer Sentiment.
Trading Perspective: The Dollar Index (USD/DXY) a favoured gauge of the US currency’s value against a basket of 6 major currencies rebounded 0.86% to 96.783 (96.084). The Index hit a high close to 103.00 on March 20 where the COvid-19 outbreak was close to or at its highest. Most of the weight in the USD/DXY comes from the Euro (57.6%). The Dollar Index potential to bounce further is intact and it will be led by a Euro decline.
Yesterday’s Euro losses were more moderate in comparison, a good point highlighted by BK Asset Management’s Managing Director of FX Strategy Kathy Lien. Lien also sees further Euro correction specially if equities continue to fall. Another correct observation. Last, but not least, speculative Euro market positioning remains long, close to multi-year highs. The Euro still has room to correct lower.
The Aussie, risk and Emerging market currencies all experienced large drops because their rallies were the strongest. Where they go from here bears watching.
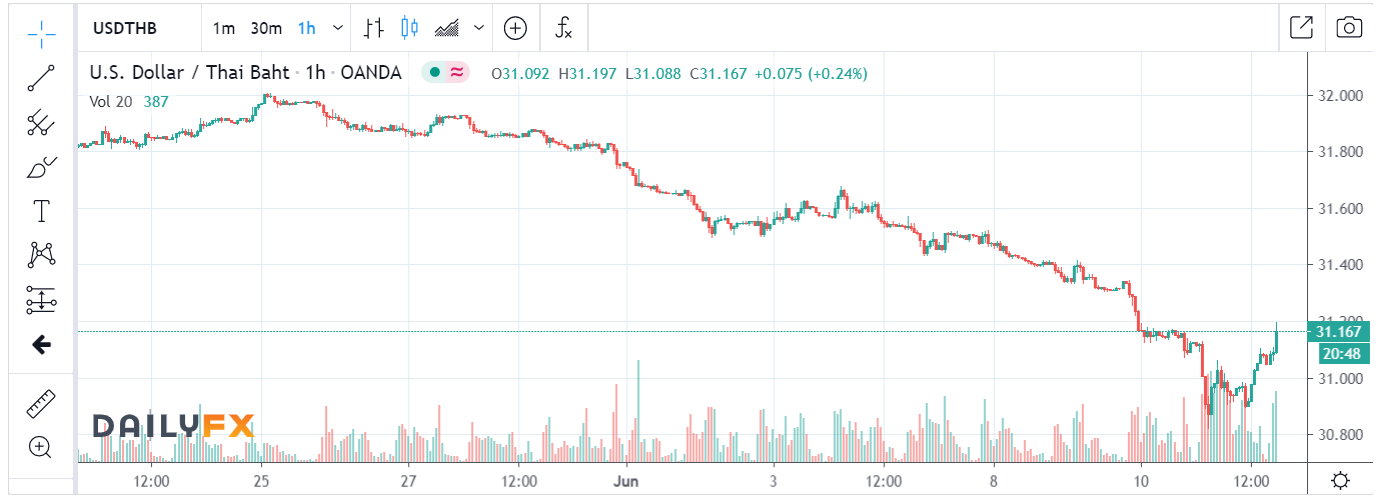
Asian Special – USD/THB – Lagging Behind – 31.00 Base, Potential Climb to 31.70
Just a special note on this Asian currency pair. The USD/THB (US Dollar-Thai Baht) finished its session in US markets at 31.10 this morning. Yesterday this USD Asian currency pair was trading at 31.12, and opens in Asian trade at its current 31.07/12. Given the fall in the Major, Risk, Emerging Market and other Asian currencies, like the Singapore Dollar, this puppy is lagging behind. If you trade an Asian currency, USD/THB is a screaming buy at current levels. Look for a likely range today of 31.10-31.60.
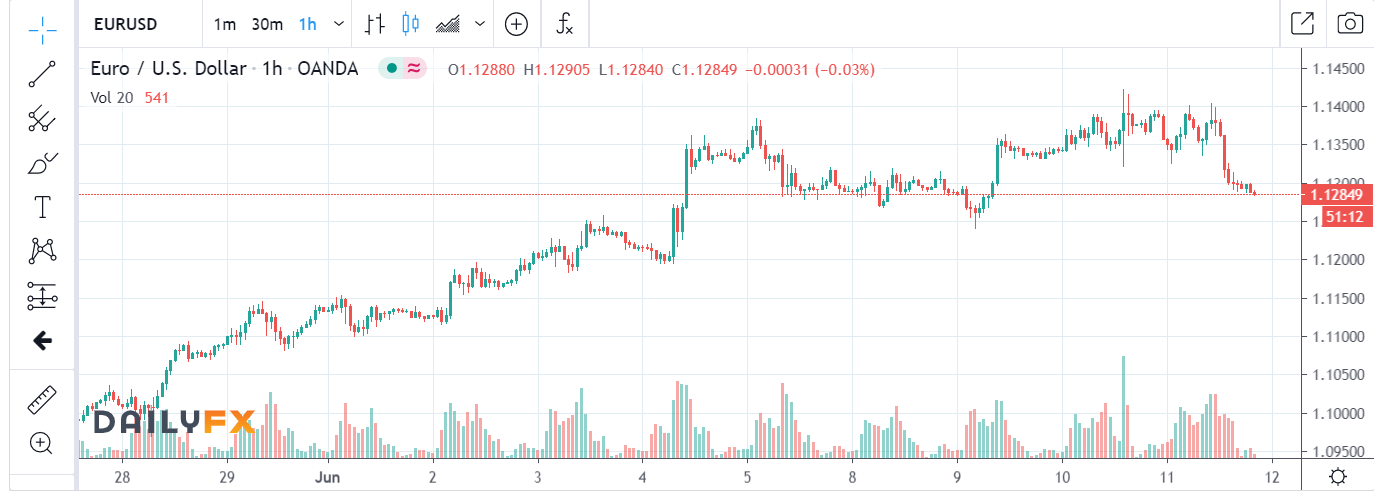
EUR/USD – Correction Has Begun, Room for More – 1.1230 Next
The Euro reversed its gains, tumbling 0.61% against the Greenback to 1.1295 at the New York close, from yesterday’s 1.1375. The Euro’s fall was more moderate compared to the other rivals of the US Dollar. Yet speculative market positioning on the shared currency is the most overbought of the 7 major IMM Greenback rivals. We reported that net speculative Euro long bets for the week ended June 2 (COT/CFTC report) rose to +EUR 81,240 from the previous week’s +EUR 75,222. Which are at multi-year highs. The die-hard bulls are not giving up easily but a break at the strong support level of 1.1230 could see them head for the exits.
There were no major European data releases yesterday. Today sees the Eurozone Industrial Production report for May. A fall of -19.0% against the previous month’s -11.3% is expected.
EUR/USD has immediate support at 1.1280 followed by 1.1250 and 1.1230. Immediate resistance can be found at 1.1330 followed by 1.1380. Look to sell rallies in a likely trading range today of 1.1230-1.1330.
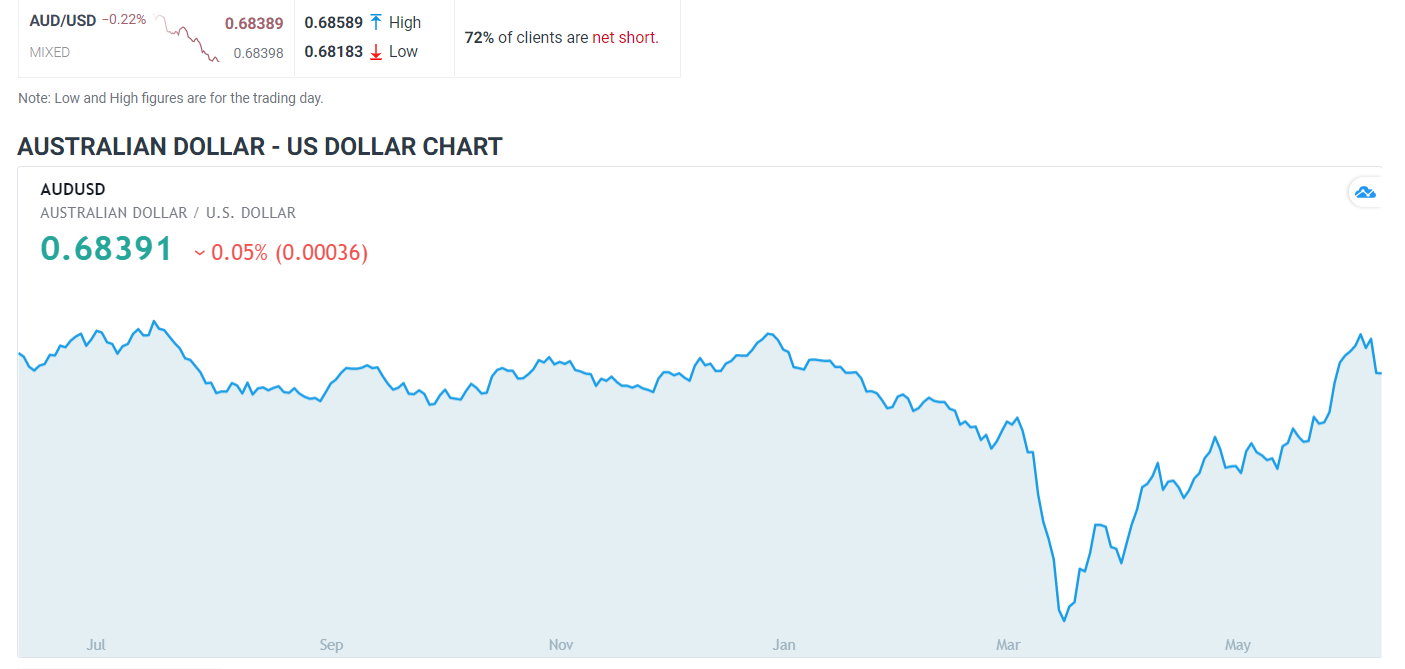
AUD/USD – “What Goes Up, Must Come Down, Spinning Wheel..” 0.6750 Supports
The Australian Dollar led all growth currencies lower on the negative change to risk sentiment, tanking 1.65% to 0.6850 from 0.7000 yesterday. In early Asian trade, the AUD/USD pair currently sits at 0.6840 after slipping further to 0.6818 lows earlier this morning. Most of the Aussie Dollar’s sharp move higher was due to the positive risk sentiment and the fact that Australia (and New Zealand) effectively flattened their Covid-19 curves. Yesterday, only 9 new cases were reported in Australia.
The ongoing tensions between China and Australia have been for the most part ignored by FX. However, tensions between the two trading partners have heated up. China has threatened Australia by warning its students who study in Australian universities not to return due to racism against Asians in the country. Which is overplayed due to a few isolated incidents which happened at least 2 months ago.
AUD/USD has immediate support at 0.6810 followed by 0.6770. Immediate resistance can be found at 0.6890 and 0.6920. Look for the Aussie Battler to consolidate with a likely range of 0.6780-0.6920.
Prefer to sell rallies but am prepared to go on either side of this range. We can expect high volatility in this currency pair again. Happy days !