Asian markets finished mixed today as President Trump issued an executive order declaring a national economic emergency that empowers the government to ban the technology and services of “foreign adversaries” deemed to pose unacceptable risks to national security. The Nikkei225 gives up 0.69 percent to 21,042 the Hang Seng benchmark in Hong Kong finished 0.24 percent higher at 28,336. The Shanghai Composite added 0.28 percent to 2,947 while in Singapore the FTSE Straits Times index finished 0.05 percent higher at 3,220. Australian stocks trading 11 points higher or 0.16% to 6,381.
In commodities markets, crude oil trades higher at 62.34 after mounting tensions in the Middle East. Brent oil adds one dollar at $72,16 per barrel. Gold consolidates at 1295 as it retreated from the recent high at 1303. Investors turned to safe assets amid escalation in US-China trade war. XAUUSD technical picture is bullish as the precious metal holds above the 50 and 100-day moving averages. Gold will find support at 1290 the 50-hour moving average and on the upside, resistance stands at 1307 the high from April 10th, 2019.
In cryptocurrencies market, bitcoin (BTCUSD) trades slightly lower at 7,930 as it eyes for a convincing break above the 8,000 resistance. The daily low for BTC was at 7,845 and the daily high at 8,379. BTCUSD immediate support stands at $7,503 level the 100-hour moving average and then at the 7,000 round figure. On the upside, strong resistance stands at 8,379 the high from the Asian session. On Monday the CME Bitcoin futures reached an all-time record high of 33.7k contracts. Ethereum (ETHUSD) is the outperformer in the cryptos universe today as it continues higher for the fifth day in a row and adds another 25 dollars to 253, on the upside the immediate resistance stands at 273 the high during the US session while the support stands at 200, Litecoin (LTCUSD) mirrors major cryptocurrencies higher at 98.40. The crypto market cap holds above $175.0B.
On the Lookout: In Australia, the ABS reported a mixed set of labor force data. The employment rose for the ninth straight month, up by 28,400 in April after a revised 27,700 increase in jobs in March, which was previously reported as a 25,700 increase in jobs. Fulltime jobs fell by 6,300, but part-time jobs rose by 34,700. Analysts had tipped an increase in total jobs of around 15,000.
In the US according to the Department of Commerce, in seasonally-adjusted terms, retail sales volumes slipped by 0.2% month-on-month to reach roughly $513bn, although excluding sales of automobiles they edged higher by 0.1%, helped by a jump in gasoline station sales. Economists had forecast a rise in total sales of 0.2% month-on-month and an increase of 0.7% excluding automobiles. The industrial output growth in the States missed forecasts by a wide margin last month as manufacturing added to a growing list of monthly declines.
In the America economic calendar, we await the US Jobless Claims, Housing Starts, Building Permits and Philly Fed Manufacturing Index, all will be released at 12:30GMT. At the same time, the Canadian ADP Jobs and Manufacturing Sales data will grab some attention.
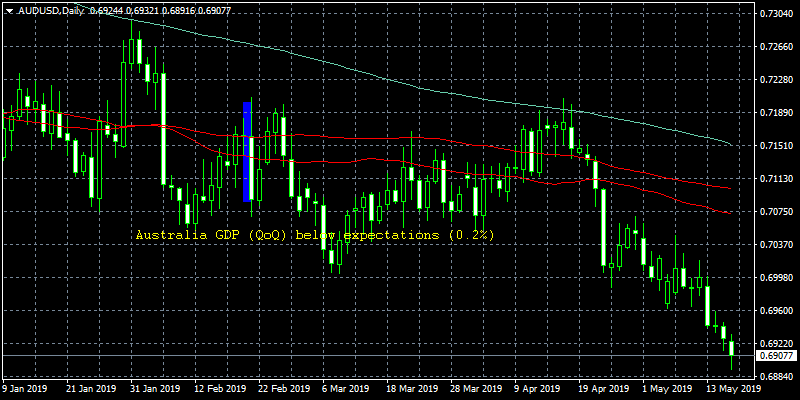
Trading Perspective: In forex markets, the US dollar trades flat at 97,35 as traders digest the developments in US-Sine trade war. A stronger US dollar will likely increase the US trade deficit, adding risk that Trump administration continues to target those nations with a significant trade surplus with the US (China – Germany – Europe). The Aussie dollar continues its trip south for another day to 0.6912 after the disappointing labor figures. Kiwi also gives up some cents to 0.6549.
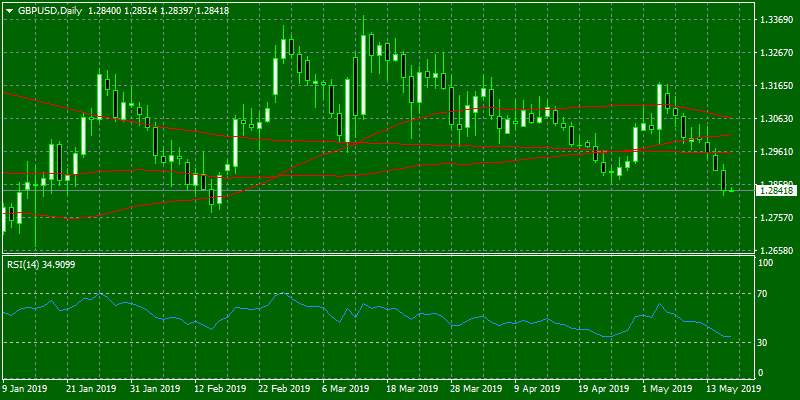
GBPUSD is the majors worst performer for one more day after the pair lost yesterday the 1.29 and trades down to 1.2845 due to Brexit uncertainty. The pair hit the daily low at 1.2839 and the daily high at 1.2851. On the downside, major support will be found at 1.2839 the low from Us session. On the upside, immediate resistance stands at 1.29 and then at the 100-day moving average around 1.2957.
In Sterling futures the open interest increased for the third session in a row, this time by almost 6.8K contracts, the volume also went up for yet another session by more than 15K contracts.
EURUSD trades some pips higher at 1.1207, getting a hand by US President Trump that he will delay the decision on the auto tariffs on the EU. The pair made the Asian high at 1.1210 and the low at 1.1201. Immediate support can be found at 1.1180 the 200 hours moving average while more solid support can be found at the yearly low at 1.1115. On the upside, the immediate resistance stands at 1.1236 the bottom of horizontal resistance line from the three-month trading range, while more offers will emerge at 1.1268 at the 50-day moving average.
In euro futures, the open interest shrunk for the fourth consecutive session on Wednesday, this time by more than 3K contracts. Volume rose by nearly 17.5K contracts, clinching the third build in a row.
USDJPY consolidates in mid 109 as traders turn their eyes to safe assets amid renewed China-USA trade worries. Today the pair hit the low at 109.33 and the high at 109.58. The pair will find support at 109.14 yesterdays low, on the upside immediate resistance for the pair stands at 110 round figure and then at 110.50 the 100-day moving average and then at 111.17 the 50-day moving average.
USDCAD is trading lower today at 1.3432 as higher crude oil prices, Canada’s main export item, seems to have added further strength in the Canadian Dollar (CAD). The pair will find immediate support at the 100-day moving average around 1.3335 while extra support stands at 1.3300 round figure. On the upside, immediate resistance stands at 1.3476 the high from yesterday, while a break above can escalate the rebound towards 1.35 round figure.