Summary: The US Dollar tsunami sent currencies around the world tumbling as company funding demand spiralled out of control. Sterling was the hardest hit among the majors, plummeting to 1.1450, its lowest level since the October 2016 flash crash. GBP/USD was trading at 1.1585 in late New York, a loss of 4.2%. The number of coronavirus deaths in the UK doubled in the past 24 hours, bringing to question Britain’s soft approach to the pandemic. Commodity currencies the Australian and New Zealand Dollar touched multi-year lows. The Aussie extended its slump to an overnight and 2003 low at 0.5702, before bouncing to close at 0.5790, down 3.2%. NZD/USD finished at 0.5760 from 0.5930, a loss of 3.3% after notching a 2009 low at 0.5695. USD/CAD soared to 1.4651 fresh 4-year highs as Crude Oil prices slumped anew. USD/CAD eased to settle at 1.4462. The Euro fell victim to King Dollar, slumping 1.02% to 1.0897 in early Sydney after touching 1.0802, 2017 lows. The Dollar decimated the Emerging Market Currencies. Against the Russian Rouble, the Greenback was up 8.05% at 80.88 (75.30). Brent Crude Oil prices spiralled lower, finishing at USD 27.50 from yesterday’s USD 29.70.
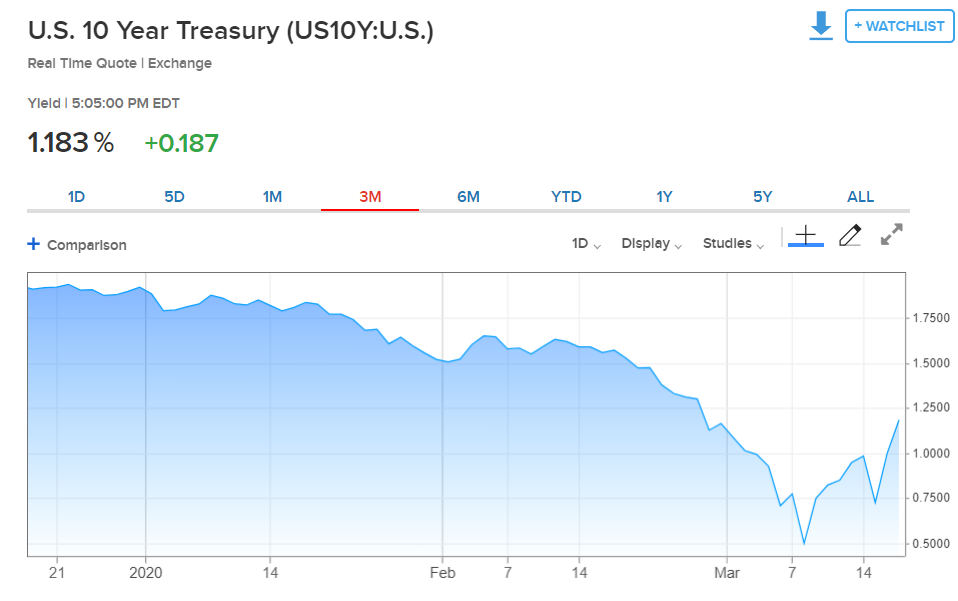
Equities slumped anew. In late New York trade the DOW was 4.5% down to 19,995 (21,110). The S&P 500 lost 3.0% to 2.410 (2,530). Bond markets slumped as borrowing costs from companies around the globe surged. Treasury yields jumped. The key US 10-year bond yield was up 11 basis points to 1.19%, its highest level since late February. Germany’s 10-year Bund yield jumped 25 basis points to -0.25%.
The Eurozone Final Headline CPI rose an annualised 1.2% in February, matching forecasts. Canada’s Headline CPI (February) rose 0.4%, equalling forecasts. US Building Permits in February dropped to 1.46 million units from January’s 1.55 million. Housing Starts climbed to 1.60 million units from the previous month’s 1.57 million.
On the Lookout: Demand for the US Dollar remains strong and its difficult to see anything in the way of the tsunami its created. Global markets are in panic mode because of the coronavirus outbreak and harsh actions to tame it. Monetary measures introduced by the central banks and multibillion Dollar stimulus by governments have failed to restore investor confidence.
Today the focus is on the Australian Employment report for February (11.30 am Sydney time) ahead of the RBA rate decision (2.30 pm Sydney time). Australia is expected to have created 10,000 jobs in February from January’s 13,500. RBA Governor Philip Lowe speaks at a press conference in Sydney following the meeting (4 pm Sydney).
New Zealand reported that its Q4 GDP growth was at 0.5%, matching forecasts of 0.5%. Data releases that follow start with Japan’s National Core CPI report and All Industry Activity Index. Switzerland follows with its Trade Balance. The Swiss National Bank has its rate policy meeting (7.30 pm Sydney). Eurozone Construction Output follows. US data start with Philadelphia Fed Manufacturing Index, US Current Account, Weekly Unemployment Claims, Conference Board Leading Indicators.
Trading Perspective: The Dollars demand is a direct result of liquidity concerns as companies need Dollars to settle transactions. The Fed and other central banks will coordinate to provide that Dollar liquidity across the globe through swap lines established for this purpose. Which will in turn see Dollar demand and the Greenback ease. Against the EM currencies, USD strength has spiralled out of control and we can expect intervention from some of the EM countries to ease the pressure on their currencies. FX moves have been swift and the best way to trade is to get in and out quickly. Don’t get married to any views, pick your ranges and trade accordingly.
NZD/USD – Nears Fresh 11-Year Lows, RBNZ Vigilant
The New Zealand Dollar or Kiwi fell under the weight of King US Dollar, slumping to an overnight and fresh 2009 low at 0.5702 before bouncing to settle at 0.5760, down 3.27%. The Kiwi dipped to 0.5740 following the release of New Zealand’s Q4 GDP which matched forecasts at 0.5%, while the previous quarter’s GDP was revised upwards to 0.8% from 0.7%.
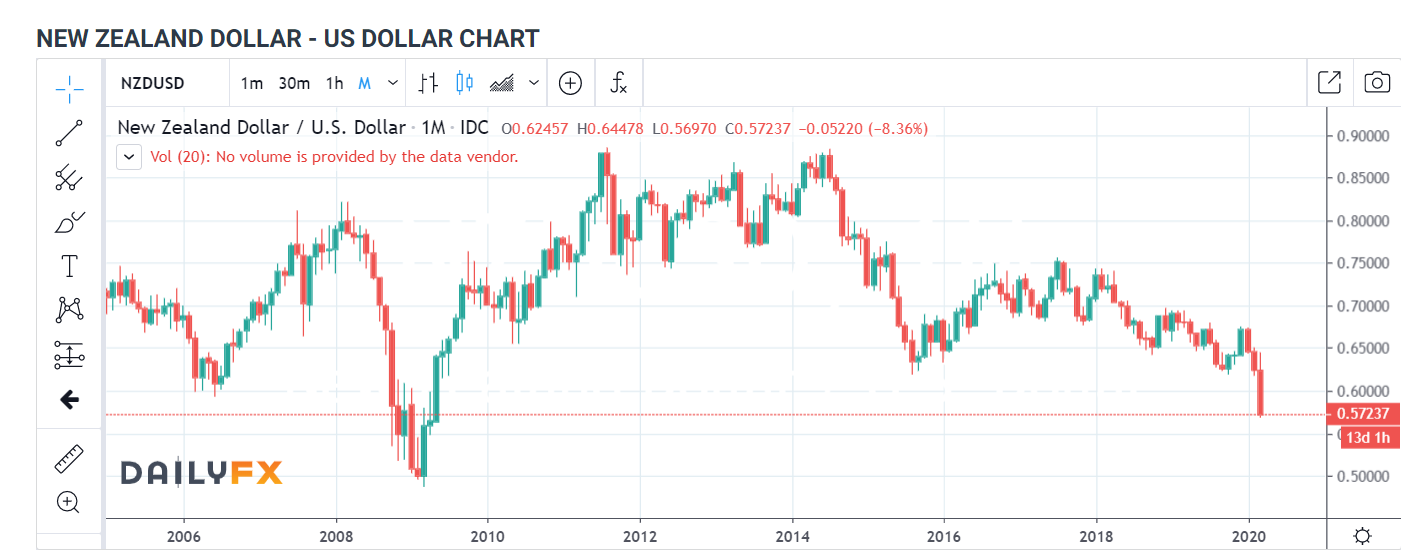
Meantime the RBNZ commented that it is aware of the current market developments and they are not unanticipated or unusual. Just yet. The Kiwi or “Bird’ as many FX traders refer to it is also part of the commodity or dollar bloc currencies and has suffered together with its bigger cousin currency, the Aussie. New Zealand’s 10-year bond rate climbed 12 basis points overnight, to 1.18%. New Zealand is also a food exporter. Which should be supportive of the economy.
NZD/USD has immediate support at 0.5730 followed by 0.5695 and 0.5670. Immediate resistance can be found at 0.5780 followed by 0.5830. Look to buy dips in a likely range of 0.5710-0.5860.
AUD/USD – Under Pressure at Multi-Year Lows, Aussie Jobs, RBA Up Next
The Australian Dollar plummeted anew against the broad-based US Dollar advance, falling commodity prices, and soft Emerging Market currencies. AUD/USD hit fresh 2003 lows at 0.57018 before bouncing to close at 0.5800 in late New York trade. The Aussie Battler eased in early Sydney to its current 0.5790 level.
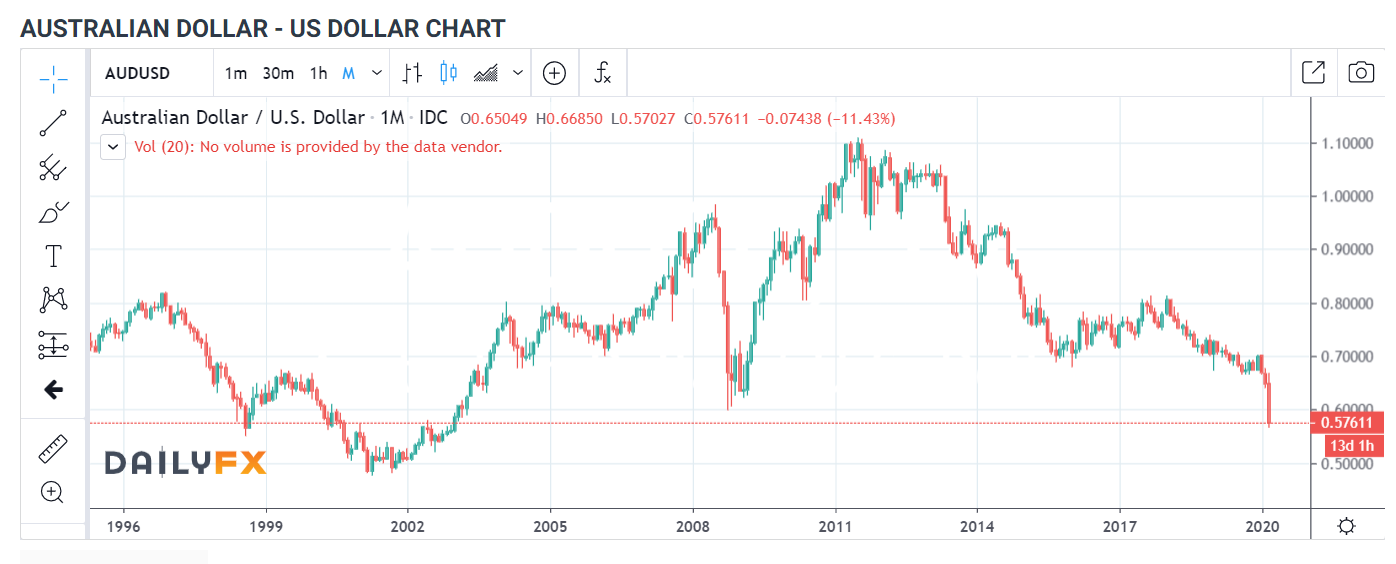
Traders will keep their eyes on the Australian Employment report for February (11.30 am Sydney) ahead of the RBA rate decision (2.30 pm Sydney). The Australian economy is expected to have created 10,000 jobs in February from January’s 13,000. The Unemployment rate is expected to remain unchanged at 5.3%. RBA Governor Philip Lowe speaks to the press in Sydney following the meeting at 4.00 pm. The RBA is expected to announce further measures to counter the deadly Covid-19.
Traders have 2003 low around 0.5670 as the next target for the Battler. Immediate support ahead of that lies at 0.5760 followed by 0.5710. Immediate resistance can be found at 0.5830 and 0.5880. While the Aussie remains heavy, bear in mind that we are near or at multi-year lows in the AUD/USD and AUD Trade Weighted Index. For this writer, it is dangerous to get short down here. Look to trade a likely range today of 0.5730-0.5880. Tin helmets on, trade the range but don’t stay short for long.
EUR/USD – Strong Bounce Off 1.0800, ECB Launches Emergency Purchase Program
The Euro bounced off its 1.0895 New York close to 1.0980 in early Asian trade following the announcement from the ECB that it is launching at EUR 750 billion pandemic emergency program (PEPP). According to FX Street, the European Central Bank will introduce a new temporary asset purchase program of private and public sector securities to counter serious risks to the monetary policy transmission mechanism.
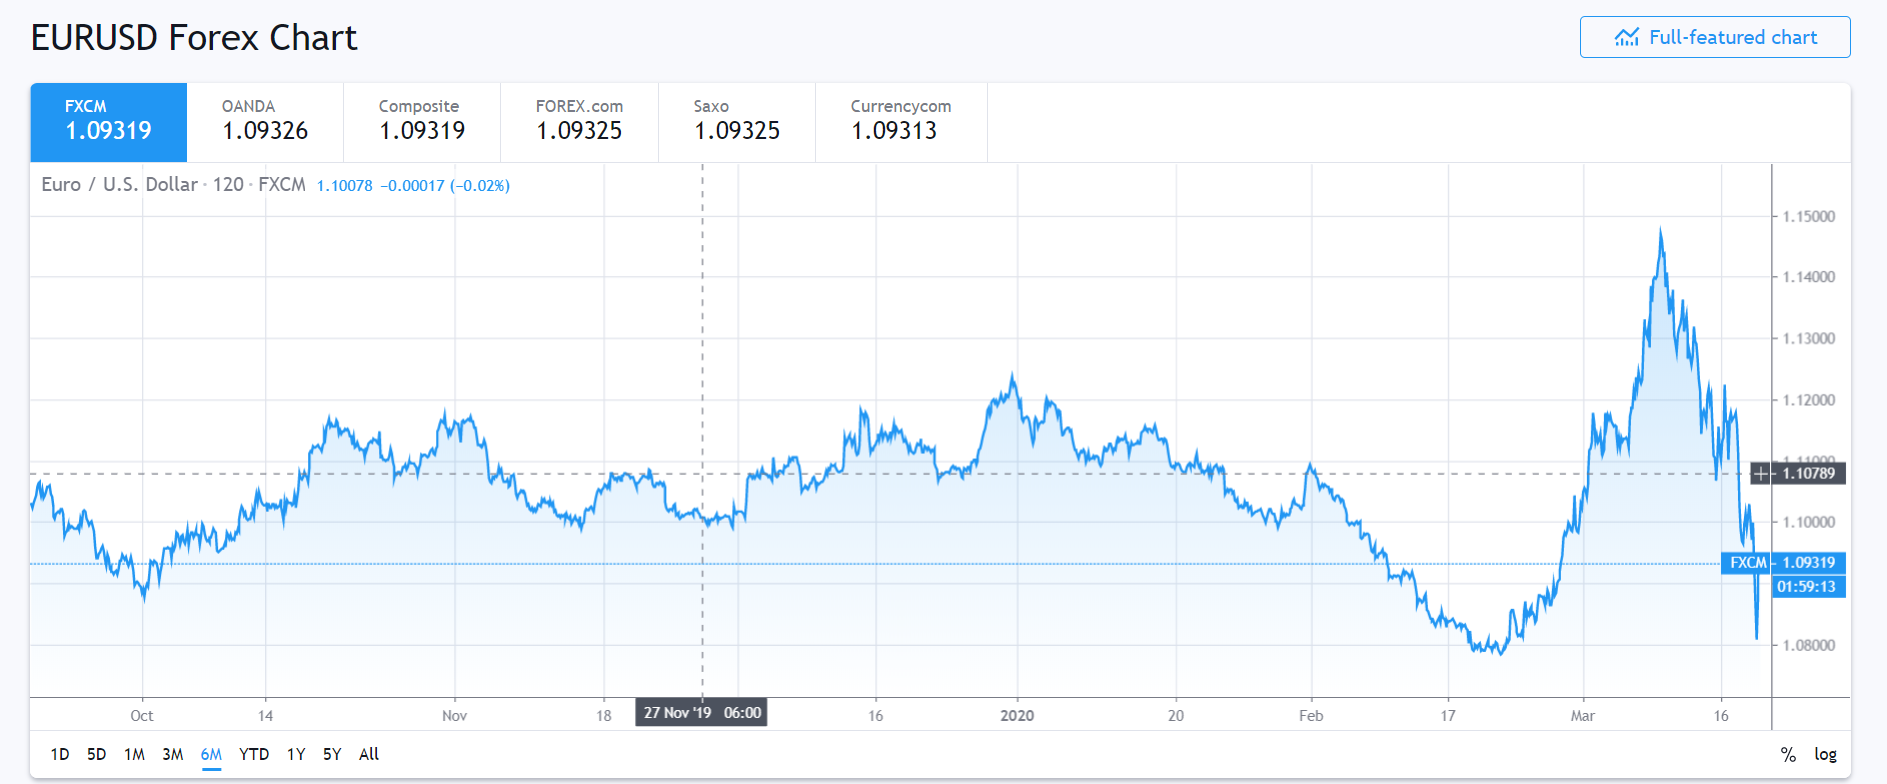
Germany’s 10-year Bund yield was up 19 basis points to -0.25% while US 10-yaer rates were at 1.19%, up 11 basis points. This rate differential will narrow again and that will support the shared currency against King Dollar.
EUR/USD hit an overnight and one-month low at 1.0800 before rebounding to close at 1.0895 in New York. The Euro jumped to 1.0980 before easing to settle at its current 1.0955 in choppy trade.
EUR/USD has immediate resistance at 1.0980 followed by 1.1030. Immediate support can be found at 1.0900 followed by 1.0870. Look for a likely trade today of 1.0885-1.1035. Prefer to buy dips.