By Antreas Themistokleous, an analyst at Exness.
This preview of weekly data looks at USOIL and XAUUSD where economic data coming up later this week are the main market drivers for the near short-term outlook.
The most important economic data for this week are: Canadian inflation, FOMC minutes, Japanese inflation and Fed chair speech
Tuesday:
- Canadian inflation rate at 12:30 PM GMT. The expectation is for the figure to remain stable at 2.7% for the month of July. In the case of a surprise on the actual figure it would most likely going to create volatility on the majority of the loonie pairs.
Wednesday:
– Advertisement –
- FOMC Minutes at 18:00 GMT where investors and traders will be paying close attention to any hints from the Federal Reserve in terms of future developments on the monetary policy. Currently, the possibilities of a rate cut have been gaining ground for the September meeting which is currently more than 70% according to the Fedwatch tool whereas any hawkish narratives might push the prospectus of a rate cut further down the road.
Thursday:
- Japanese inflation rate at 23:30 GMT. The expectations for the month of July is that the rate could go up to 2.9% from the previous 2.8%. This might be somewhat bullish news to the market participants trading the yen.
Friday:
- Fed chair Jerome Powell will be giving a speech about the economic outlook at the Jackson Hole symposium in Wyoming this Friday around 10 a.m New York time. The central bank is near a major pivot point where rate cuts are broadly anticipated and the bet would be what the Fed chair would comment at a potential openness for a 50 basis-points move or what are the views of the central bank after the first rate cut happens.
USOIL, daily
Oil prices eased due to fears of weaker demand in China and the approaching end of the peak driving season in the United States. Despite concerns about slow demand in China, tensions in the Middle East and the Russian-Ukrainian conflict are providing support to the oil market. Ceasefire talks in the Middle East, led by U.S. Secretary of State Antony Blinken, are ongoing, but doubts remain as violence continues in Gaza. China’s economic slowdown, including declining home prices and reduced crude processing rates, has fueled anxieties about potential demand slump adding more bearish pressure on the price.
On the technical side, the price has tested the support of the 23.6% of the daily Fibonacci retracement level and has since corrected to the upside in today’s session. The 50-day moving average has touched the 100-day moving average line and it remains to see if it will cross below it or if it will continue trading above it. The Stochastic oscillator is in neutral levels hinting that the price has the potential to move to either direction in the short term while the Bollinger bands are still expanded showing the fueled-up volatility in the market. If the 23.6% of the Fibonacci holds in the coming sessions it is possible to see a bullish correction move with the first area of technical resistance being the $76 which is the psychological resistance of the round number as well as just below the 38.2% of the Fibonacci retracement level.
Gold-dollar, daily
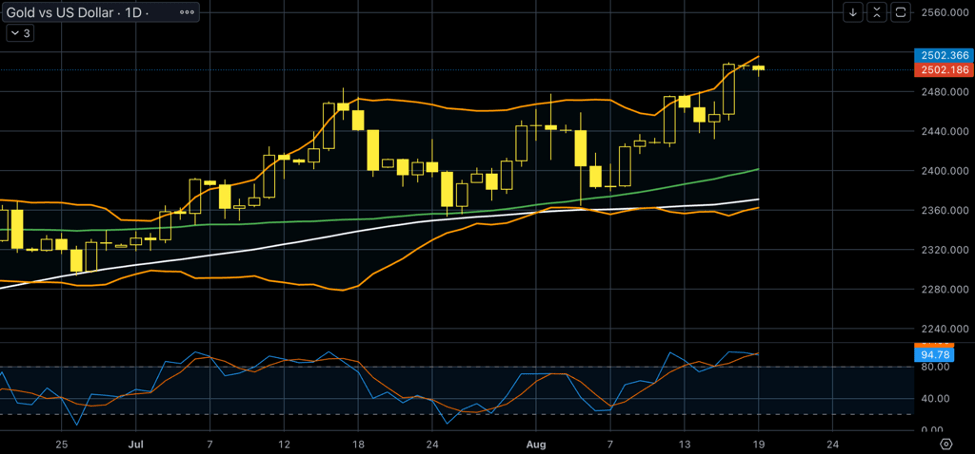
Gold prices reached a new all-time high near $2,500 mainly driven by expectations of a U.S interest rate cut and geopolitical tensions. The recent rise in gold price was driven by dovish Fed expectations and rising geopolitical tensions, overshadowing positive economic data from the US. Gold prices are also being influenced this week by the upcoming FOMC minutes and Fed Chair Powell’s speech. Traders are closely monitoring for signals from the Federal Reserve, particularly regarding the potential size of the rate reduction and the impact it will have on gold prices. Factors such as a slowing U.S. economy, upcoming rate cuts, lower yields, and strong central bank demand are expected to continue driving gold prices upward in the longer term.
From a technical point of view, the price has found sufficient support around the $2,440 price and has since continued trading North even above the upper band of the Bollinger bands indicating that volatility is increasing in the market for gold. Even though the 50-day moving average is trading above the 100-day moving average validating the overall bullish trend, the Stochastic oscillator is in the extreme overbought levels hinting that there might be a bearish correction in the near short term. If this becomes reality then the first area of possible support might be found around the $2,480 which is the psychological support of the round number as well as an area of price rejection in mid-July and mid-August.
Disclaimer: the opinions in this article are personal to the writer and do not reflect those of Exness or Finance Feeds.
The subject matter and the content of this article are solely the views of the author. FinanceFeeds does not bear any legal responsibility for the content of this article and they do not reflect the viewpoint of FinanceFeeds or its editorial staff.