This preview of weekly data looks at USOIL and XAUUSD where economic data coming up later this week are the main market drivers for the near short-term outlook.
Highlights this week: British GDP, US inflation and Fed rate decision, US PPI, BoJ rate decision
Tuesday:
- British unemployment at 06:00 AM GMT for the month of April is expected to hold steady at 4.3% while the claimants are expected to increase to 10,200 for the month of May compared to the previous recording of 8,900.
Wednesday:
- Chinese inflation rate at 01:30 AM GMT. The market is expecting this figure to remain stable at 0.3% for the month of May.
- British GDP growth at 06:00 AM GMT. The market consensus is that the figure will decrease from 0.4% to 0% month over month. This might not have a major effect on the quid since it is for the month of April however it would provide some hints on the overall economic performance of the British economy.
- US Inflation rate at 12:30 PM GMT where the expectations are for the figure to remain unchanged at 3.4% while core inflation is expected to decline by 0.1% for May. A worse-than-expected figure would most probably push the expectations of the rate cut even further while a lower inflation figure could boost the probabilities of an earlier rate cut by the Fed.
- Fed interest rate decision at 18:00 GMT is broadly expected to keep steady at 5.5% with the probabilities of a cut being less than 1%. Participants are focusing closely on what the comments in the subsequent press conference will be in an effort to get some hints as to the future direction of monetary policy.
Thursday:
- S Producers Price Index (PPI) at 12:30 GMT. Market participants are expecting the figure to come out at 0.2% over 0.5% of the previous reading. If this is confirmed then it could potentially hint to lower inflation figures in the coming months.
Friday:
- BoJ Interest rate decision at 03:00 AM GMT. The market consensus is that the rates will remain static at 0.1% while in the unlikely scenario of any shift away from this figure will most certainly create volatility on the yen pairs.
USOIL, daily
Crude oil prices saw a slight gain at the start of the week due to expectations of higher fuel demand during the summer driving season. Strong U.S. jobs data dampened expectations of rate cuts, leading to market uncertainty and a reduction in net long positions in oil markets.
The upcoming OPEC and IEA reports, along with the US Federal Reserve’s interest rate decision, will serve as crucial indicators of the oil industry’s health and future direction.
Market uncertainty prevails due to conflicting economic data and mixed messaging regarding potential US interest rate cuts, which typically impact oil demand and prices.
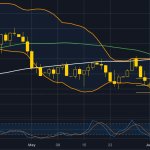
On the technical side, the price has rebounded from the low of $72.50 and is currently testing the resistance of the 38.2% of the daily Fibonacci retracement level. The Bollinger bands are quite expanded showing that volatility is high in the market for crude oil while the Stochastic oscillator has ticked up from the oversold area and is now in neutral levels. The combination of the Bollinger bands and Stochastic oscillator indicates that there is momentum in the market and the price has the potential to move sharply to any direction in the short term. On the other hand, the 50-day moving average has recently crossed below the slower 100-day moving average validating the overall bearish trend in the market.
Gold-dollar, daily
Gold prices dropped below $2,300 in response to strong US nonfarm payrolls data signaling a robust economy. Gold prices remained steady after a sharp drop caused by China’s central bank pausing purchases. Expectations of a Federal Reserve interest rate cut in September decreased to around 50% according to the Fetwatch tool while the focus is on the upcoming Federal Reserve policy meeting, comments from Fed Chair Jerome Powell, and U.S. inflation data, which could impact gold prices and Treasury yields.
From a technical point of view, the price dropped massively on Friday and found sufficient support on the lower band of the Bollinger bands which holds strong until the time of this report being written. The extensive decline in a single day also pushed the Stochastic oscillator into the extreme oversold area for now possibly hinting that a correction to the upside might happen in the coming sessions. The price area near $2,275 might be the first area of strong technical support which consists of the 38.2% of the weekly Fibonacci retracement level as well as the lower band of the Bollnger bands. If this proves to be strong enough to sustain the declining trend of the price then it is possible to see some reversal candlestick pattern forming up around this area.
Disclaimer: the opinions in this article are personal to the writer and do not reflect those of Exness or Finance Feeds.
The subject matter and the content of this article are solely the views of the author. FinanceFeeds does not bear any legal responsibility for the content of this article and they do not reflect the viewpoint of FinanceFeeds or its editorial staff.


