This preview of weekly data looks at USOIL and XAUUSD where economic data coming up later this week are the main market drivers for the near short-term outlook.
Top news coming up: European flash inflation, US GDP growth, Chinese manufacturing, US core PCE index
Wednesday:
- Preliminary German inflation rate at 12:00 PM GMT. The market consensus for the month of May is for an increase on the figure of around 0.2% reaching 2.4%. If this is broadly accurate then it could most probably influence the European inflation figure on the following day.
Thursday:
- US GDP growth for the first quarter of 2024 is expected to decline to 1.5% against the previous figure of 3.4%. If these rather pessimistic expectations are met then it might create some minor losses for the Dollar while supporting many of its instruments traded against it.
Friday:
- NBS manufacturing PMI at 01:30 AM GMT where the expectations are for a slight increase reaching 50.5 points. The NBS is larger than the Caixin (to be released early next week) and is focusing more on larger state-owned firms. If the expectations are correct then it would mean that the state-owned firms might be performing better, given the actual figure is above the 50-point level indicating that the manufacturing sector of the NBS survey might still be expanding and probably might have some effect on production-related products like oil, natural gas, silver, etc.
- Flash European inflation rate at 09:00 AM GMT. The rate for the month of May is expected to increase to 2.5% up from the previous reading of 2.4%. This could affect positively the Euro against its pairs at least in the short term.
- S core PCE at 12:30 PM GMT. The market is expecting this figure to remain stable at 0.3% but if any unexpected surprise is seen at the time of publication would most probably create volatility in the majority of the dollar pairs.
USOIL, daily

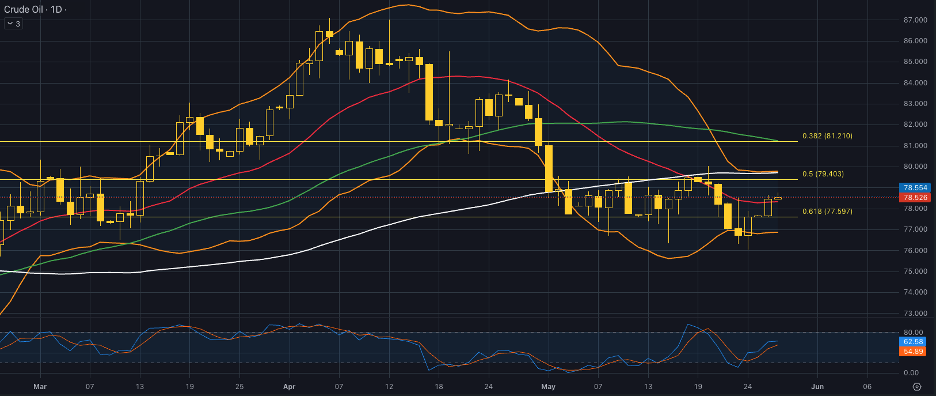
Oil prices remained stable after a significant weekly decline, with attention on the upcoming OPEC+ meeting and the start of the US summer driving season. OPEC+ is expected to extend supply cuts into the second half of the year to counteract high U.S. output and support international crude prices. The decision to hold the OPEC+ meeting online suggests a continuation of existing policies without major changes, aiming to maintain current quotas and support crude prices. Strong US demand ahead of the Memorial Day weekend, indicated by record flight activity and robust gasoline demand, is expected to provide support to oil prices. Despite geopolitical risks and OPEC+ production cuts, oil futures have decreased since mid-April as concerns about Middle East conflicts disrupting oil flows have eased.
On the technical side, the price has re-entered the trading channel between the $77.50 – $79.50 area and is currently testing the area of the 20-day moving average. The scenery is kind of mixed since the Stochastic oscillator is not indicating any overbought or oversold levels while the moving averages are not pointing to any direction in the short term. The 50-day moving average is trading above the 100-day line while the 20-day has crossed below the 100-day in the previous week. On top of everything the Bollinger bands have contracted greatly in the last 5-6 sessions hinting that volatility is dried-up therefore the most probable scenario for the coming sessions is for the trading range to continue until there is a new catalyst in the market for crude oil.
Gold-dollar, daily

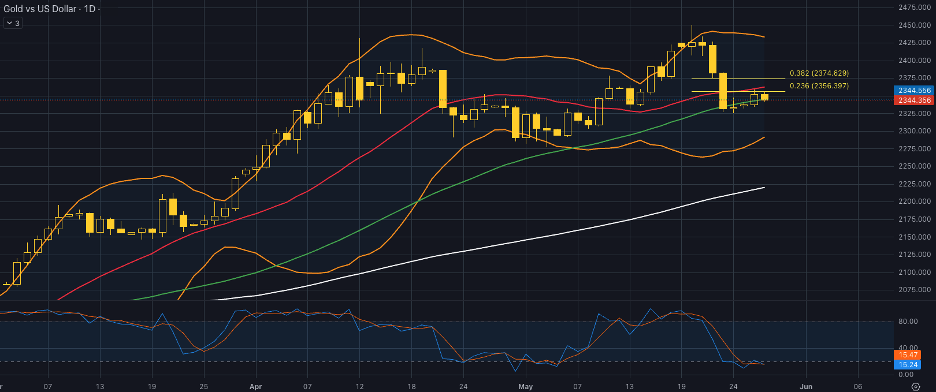
Strong US economic data and longer timeline to achieve 2% inflation target dampened hopes for Fed easing, pressuring Gold prices last week. Gold prices rose close to 1% on Monday, bouncing off two-week lows of $2,325, as US Treasury yields finished the last week down and the US Dollar weakened across the board. Upcoming US PCE Price Index is anticipated to report a core increase of 2.8% YoY and headline growth of 0.3% MoM, influencing Gold’s appeal amid thin trading due to holidays across the UK and the US.
From a technical point of view, the price of gold has recently made a correction to the downside and is now trying to get back some of these losses. The faster moving averages of 20 and 50-days are trading well above the 100-day moving average validating the overall bullish momentum. Also the Bollinger bands are quite expanded showing that volatility is still high in the market for gold while at the same time the Stochastic oscillator is in the extreme oversold area hinting that there might be a continuation of the bullish trend in the short term. At the time of this report being written the price is trading in the dynamic resistance area between the 50-day moving average and the 20-day moving average. If the price manages to break above the $2,357 price area which is the 23.6% of the Fibonacci then the next area of possible resistance might be seen around the $2,375 which is the psychological resistance of the round number as well as the 38.2% of the Fibonacci retracement.
Disclaimer: the opinions in this article are personal to the writer and do not reflect those of Exness or Finance Feeds.
The subject matter and the content of this article are solely the views of the author. FinanceFeeds does not bear any legal responsibility for the content of this article and they do not reflect the viewpoint of FinanceFeeds or its editorial staff.


