This preview of weekly data looks at EURUSD and XAUUSD where economic data coming up later this week are the main drivers in the markets for the near short term outlook.

The most important economic data for this week are:
- RBA meeting minutes on Tuesday at 12:30 AM GMT. Market participants will be monitoring this publication in an effort to get some hints on the stance of the RBA in regards to the monetary policy. Hawkish comments might give support to the Aussie Dollar while dovish news might create some minor losses.
- British unemployment on Tuesday at 06:00 AM GMT. The consensus for the month of August is that the figure will remain stable at 4.3% while claimants for September are expected to rise to 22,000.
- Canadian inflation rate on Tuesday at 12:30 PM GMT where the market expects the figure for the month of September to keep steady at 4%.
- Chinese GDP on Wednesday at 02:00 AM GMT for the third quarter of the year is expected to decline to 4.4% against the previous reading of 6.3%. On the same day there is also the publication of the industrial production from China for the month of September where the market is expecting a decline of 0.2% reaching 4.3%. If this is broadly accurate we might see some decline in the production metals like silver and copper.
- British inflation rate on Wednesday at 06:00 AM GMT. The expectations for the month of September is for a further decline of around 0.2%. This might create some minor losses on the quid since it might influence a more dovish stance on the next meeting of the Bank of England.
- European inflation rate on Wednesday at 09:00 AM GMT. The consensus is for a decline in the figure of around 0.8% to reach 4.3% for the month of September. If the consensus is confirmed we might see some short term losses for the Euro against its pairs at least in the short term.
- Fed chair J.Powell speech on Thursday at 04:00 PM GMT. As head of the Fed, which controls short term interest rates, he has more influence over the U.S. dollar’s value than any other person. Traders closely watch his speeches as they are often used to drop hints regarding future monetary policy.
EURUSD, daily
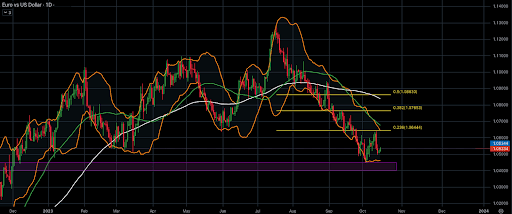
The U.S. dollar gained back the losses incurred on the Dollar index (DXY) in the previous week supporting it against other major currencies like the Euro and the British pound. The dollar remains strong as conflict in the Middle East supports demand for the safe-haven currency. Market participants are also waiting to hear the speech by Federal Reserve Chair Jerome Powell later this week for clues on the U.S. interest rate outlook as well as the inflation rate from Europe in order to better understand the short term outlook on the EURUSD pair. According to the Fedwatch Tool of CME the probabilities of a step hike in interest rates in the next meeting on the 1st of November are kept below 10% at the time of this report being written and 90% are in favor of keeping the rates at their current level of 5.25%-5.50%.
On the technical side the price has found sufficient resistance on the 23.6% of the daily Fibonacci retracement level and has since corrected to the downside. Currently it is trading just above the inside support level of $1.04500 which is an area of price reaction since late December of last year which also includes the lower band of the Bollinger bands. The 50 day moving average is still trading below the 100 day moving average validating the overall bearish momentum in the market while the Stochastic oscillator is not showing any overbought or oversold levels.
Gold-dollar, daily
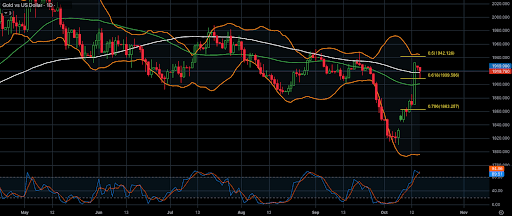
Gold prices fell on Monday due to technical selling after a strong rally in the previous session. The overall surge in prices was driven by the Israel-Hamas conflict, which prompted investors to seek the safe-haven asset and kept bullion above $1,900 per ounce. Investors are looking for stable investment opportunities during this uncertain period, and gold has met these expectations. Federal Reserve Chair Jerome Powell’s upcoming speech will be closely watched for more clarity on the US interest rate path.
From the technical point of view gold prices have managed to gain back almost 100% of the aggressive decline in late September and are currently testing the support of the 100 day moving average. In the current session the price has also tested the support of the 61.8% of the weekly Fibonacci which looks to be holding for the time being. The area of $1900 is what seems to be the major technical support area on the chart since it consists of the psychological support of the round number, the 61.8% of the weekly Fibonacci retracement level and also the ‘dynamic area’ between the 50 and 100 day moving averages.
On the other hand the Stochastic oscillator is recording extreme overbought levels meaning that it is possible to see a correction to the downside in the near short term outlook before any continuation to the upside.
Disclaimer: the opinions in this article are personal to the writer and do not reflect those of Exness or Finance Feeds.