Regardless of the outcome of last Friday’s US labor market data, our indicators for the risk of recession have fallen surprisingly over the past few days: The ‘Macro Fever Curve’ fell from 100% recession risk to 86%…
Regardless of the outcome of last Friday’s US labor market data, our indicators for the risk of recession have fallen surprisingly over the past few days: The ‘Macro Fever Curve’ fell from 100% recession risk to 86%…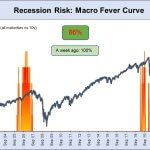
The ‘Heart Beat’, which tends to analyze the longer-term indicators of recession risk, has fallen from 83% risk to 74%. This should give the fantasies of an interest rate cut another setback…
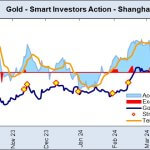
This also has an impact on trading in precious metals. However, we differentiate between trading in Shanghai and in London/Chicago. In Shanghai, the buying frenzy of Chinese investors has abated somewhat.
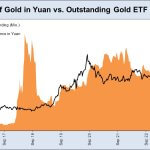
The very strong Chinese demand for gold is also reflected in the gold ETFs traded in Shanghai: the number of outstanding gold ETFs with physical backing is close to an all-time high…
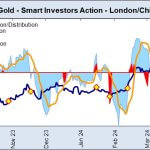
In contrast, investors in London/Chicago have interrupted their distribution and are currently standing on the sidelines. The theme of ‘profit from the higher price by taking profits’ no longer seems to be topical among Western investors…
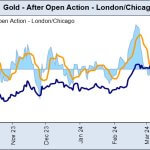
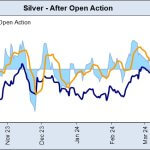
On the contrary: the ‘after open action’ suggests that Western investors are beginning to accumulate in the background. It is possible that this is short covering…
In Shanghai, a premium of over 12% is still being paid for physical silver compared to the Western markets. It also shows that the selling by ‘smart’ investors has immediately led to an ‘exaggeration’ (red area) – which usually triggers a countermovement… bullish…
As with gold, the consolidation in silver may be over…
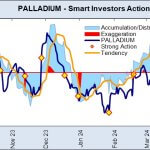
Palladium is now also gaining really strong momentum. Very strong ‘exaggeration’ and ‘strong action’ over the last few days. The next move is therefore upwards and could be stronger. A fundamental explanation for a rising market price for palladium: The EV euphoria is over, fossil-fuel vehicles are likely to remain with us for some time to come. Demand for catalytic converters is therefore likely to rise again…
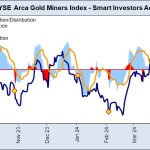
The development of the GDM Gold Seniors Index is interesting: the consolidation without an actual correction triggered a massive ‘exaggeration’. This should actually lead to a strong upward movement…
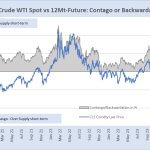
Even if the indicators at the beginning of today’s issue suggest a rather lower risk of a recession, the backwardation in oil futures has recently become smaller. It is therefore not surprising that oil prices have tended to fall…
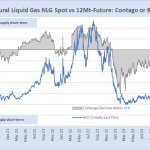
The chart of the week, however, comes from gas trading: the contango situation in LNG futures has declined massively over the last few days. A very clear sign that the hard times will soon be over and the bulls will return…
The subject matter and the content of this article are solely the views of the author. FinanceFeeds does not bear any legal responsibility for the content of this article and they do not reflect the viewpoint of FinanceFeeds or its editorial staff.


