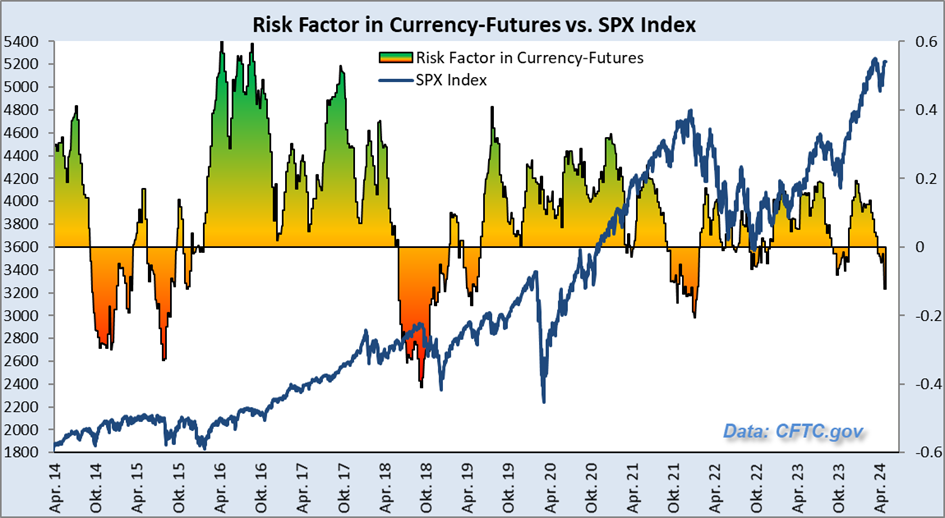
The chart of the week is the ‘Risk Factor in Currency Futures’: This compares the futures positions of institutional investors in the top currencies with those of the second line.
If investors seek positions in ‘safe’ currencies, they are less willing to take risks in the stock market and Wall Street usually reacts with corrections. Most recently, the risk factor fell massively into negative territory, indicating a ‘risk off’ attitude…
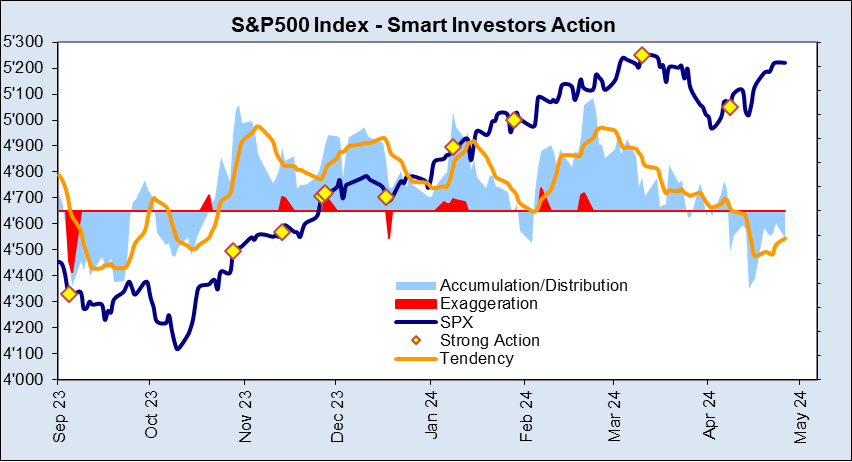
This can also be seen in the Smart Investors Action: although the S&P500 Index has almost reached the old (all-time) high again: Investors continue to distribute in the background…
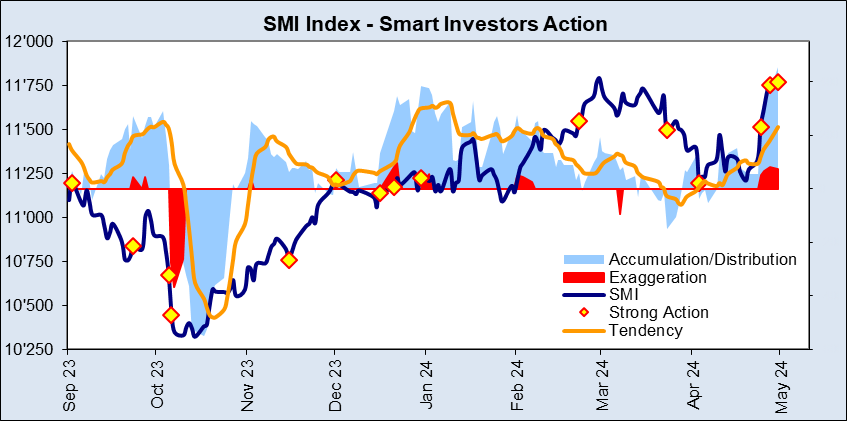
In the Smart Investors Action of the Swiss Market Index (SMI), it can be observed that accumulation is taking place again (blindly following the absolute movements of Wall Street) – and with a real buying panic: Many ‘strong action’ indications as well as ‘exaggeration’. This is usually followed by a correction…
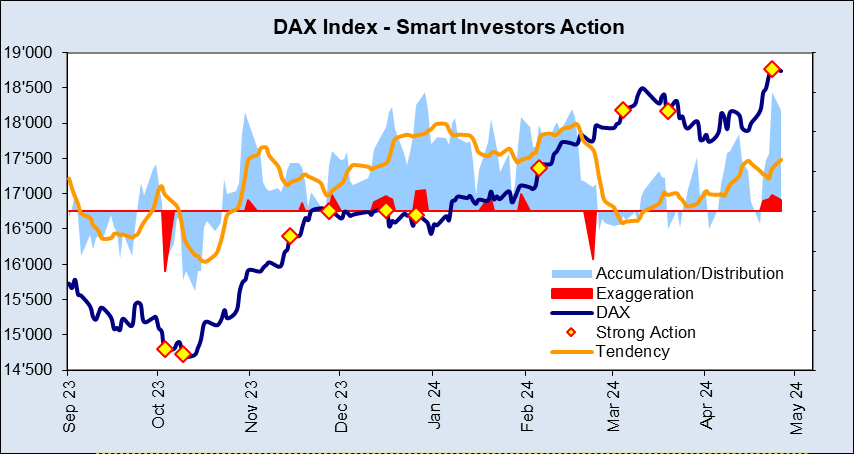
A similar picture can be seen in the German DAX index…
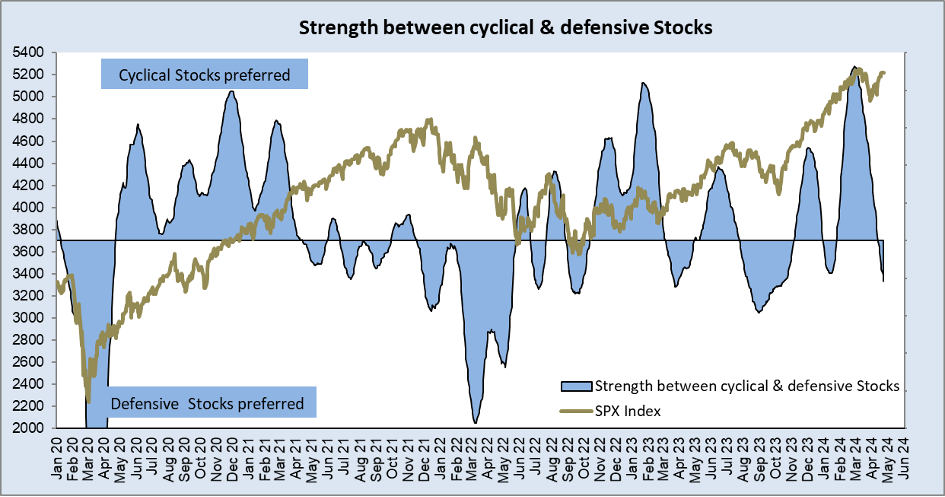
The previously favored cyclical stocks are experiencing a sell-off… confirms what was discussed in the previous charts…
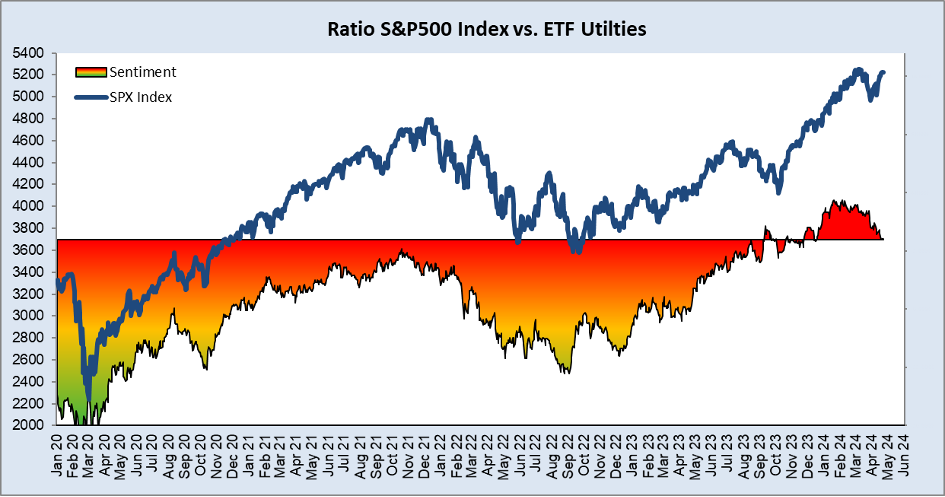
Incidentally, utilities have been one of the best performing sectors in recent weeks – which is usually the case in bearish times…
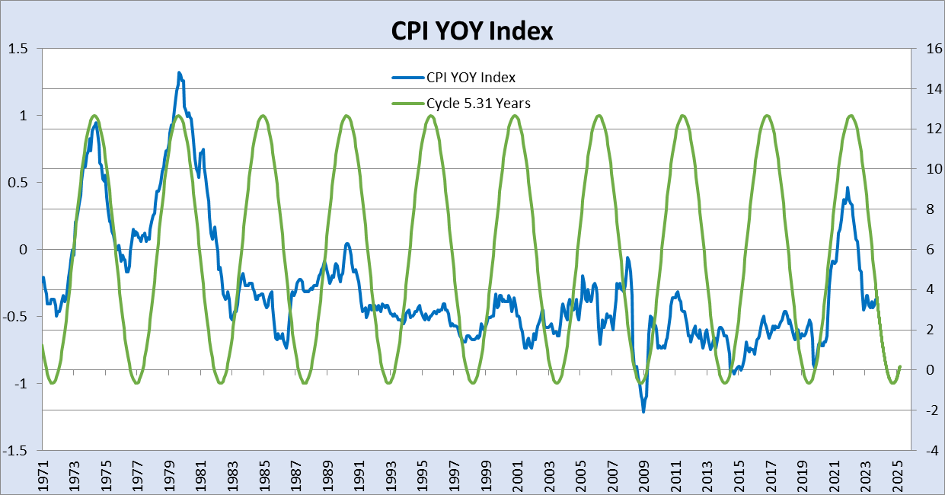
The Producer Price Index (PPI) was slightly higher than expected. The Consumer Price Index (CPI) will be published tomorrow. Regardless of the outcome: according to the Cycle, Inflation is expected to rise again from the end of the year… (The Cycle works as long as it works… – but it has been working for over 50 years now…)
The subject matter and the content of this article are solely the views of the author. FinanceFeeds does not bear any legal responsibility for the content of this article and they do not reflect the viewpoint of FinanceFeeds or its editorial staff.