Gold prices correlate with the US bond market, and the US Dollar influences the Gold/Silver ratio. Chinese market premiums for Gold and Silver suggest continued uptrends. Inflation-adjusted peaks indicate current prices are not overly expensive, implying potential for further gains.
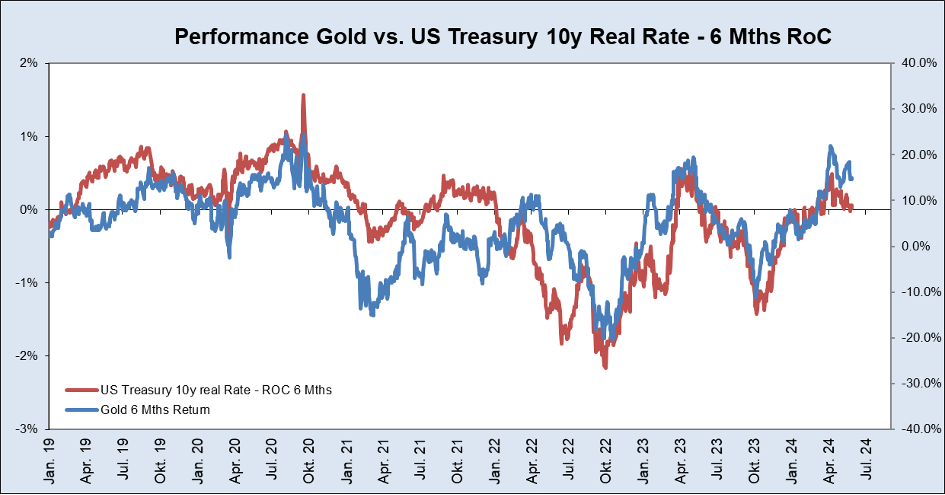
Many market participants continue to pay attention to real market yield and therefore see no reason to invest in Gold. There is no longer any correlation. Not true, the Gold price does indeed continue to correlate with the US bond market, just in a different way: the percentage changes over the last six months, an almost perfect correlation…
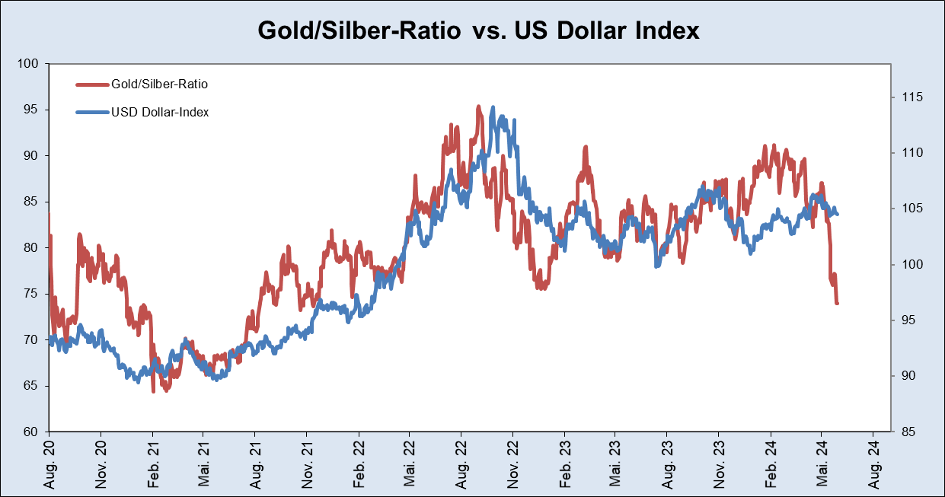
There is an equally almost perfect correlation between the US Dollar and the Gold/Silver ratio. The precious metal Silver is increasingly becoming an industrial metal due to demand for PV. Pessimistic economy, the ratio rises. Optimistic economy, the ratio falls. Recently, the ratio has fallen massively. It will now be interesting to see what happens to the US dollar…
While the Gold/Silver ratio has fallen, Gold and Silver performed very well. Are they now expensive? Not adjusted for inflation. Adjusted for inflation, the top for Gold is just over USD 2500. Silver has two important inflation-adjusted highs in the past: 2011 at around USD 70, 1980 at around USD 152. The Gold/Silver ratio was already around 90 in the 1990s, adjusted for inflation… But almost 50 years ago it was just under 30…
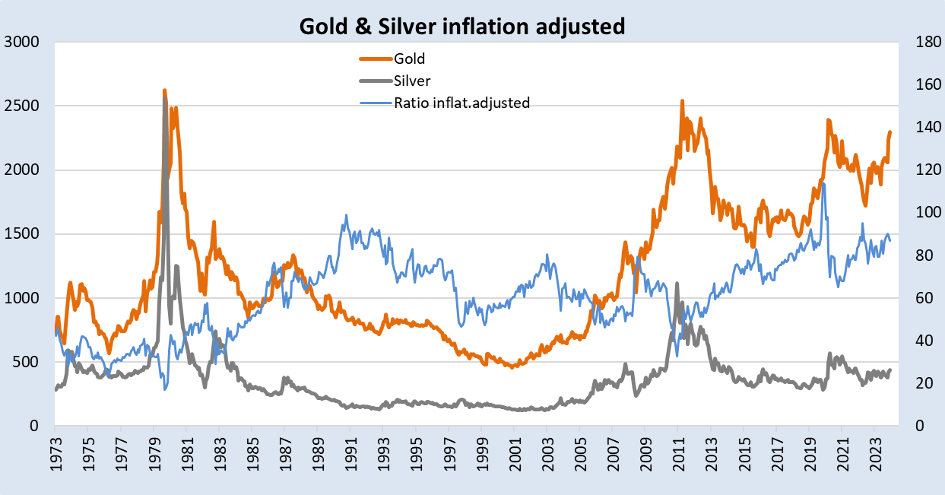
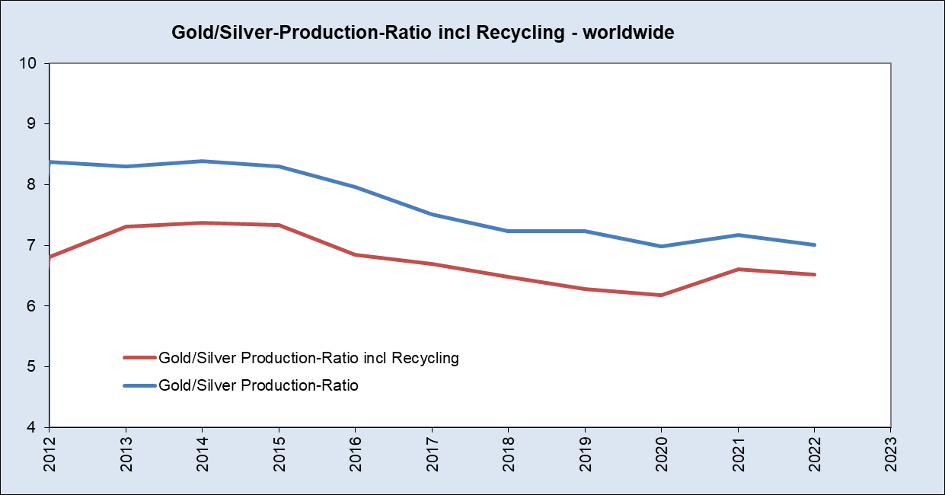
Geologically, the Gold/Silver ratio is between 15 and 20. If it were based on annual production over the last ten years, it would have to be in the region of 7… (2023 production numbers will be updated soon…)
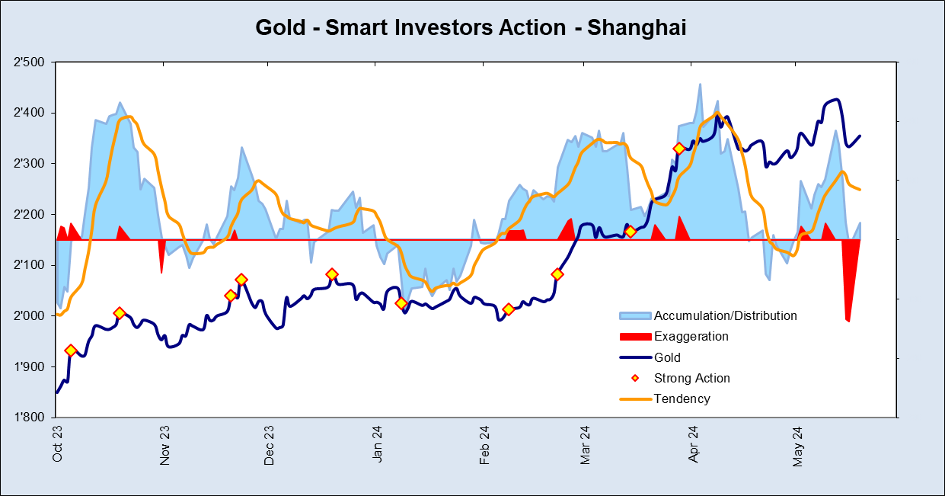
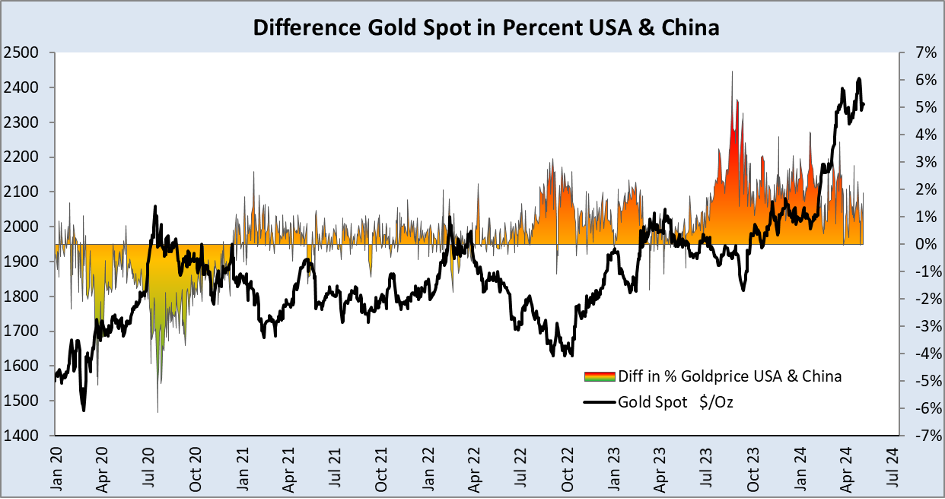
What’s the situation in day trading? Interesting! The gold price recently corrected slightly again. And my analysis of gold trading in China immediately showed massive “exaggeration” (red area), an exaggeration to the downside, which is usually answered with a counter-reaction. Very bullish!
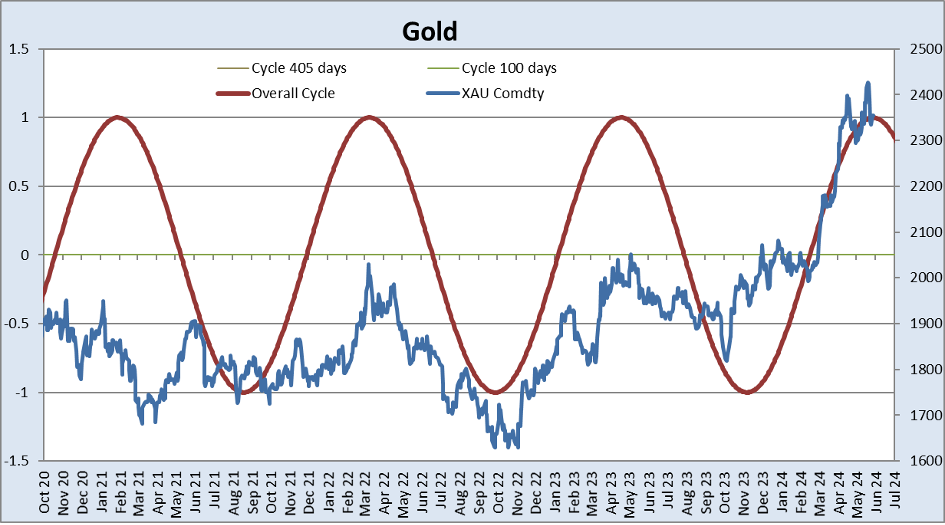
The cycle continues to be confirmed: An important high could be expected in the course of late June/early July. Let’s hope for all Gold and Silver bulls that this cycle will finally come to an end!
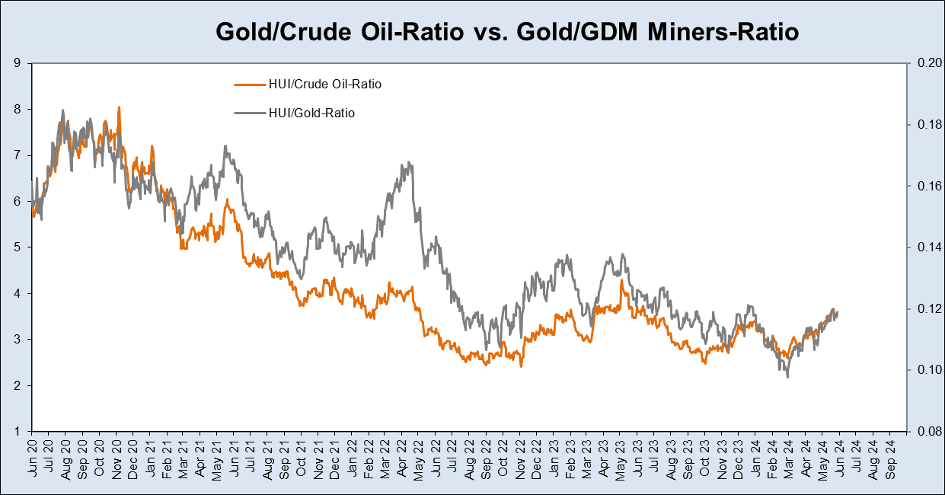
The Goldminers Index GDM continues to have high intrinsic strength…
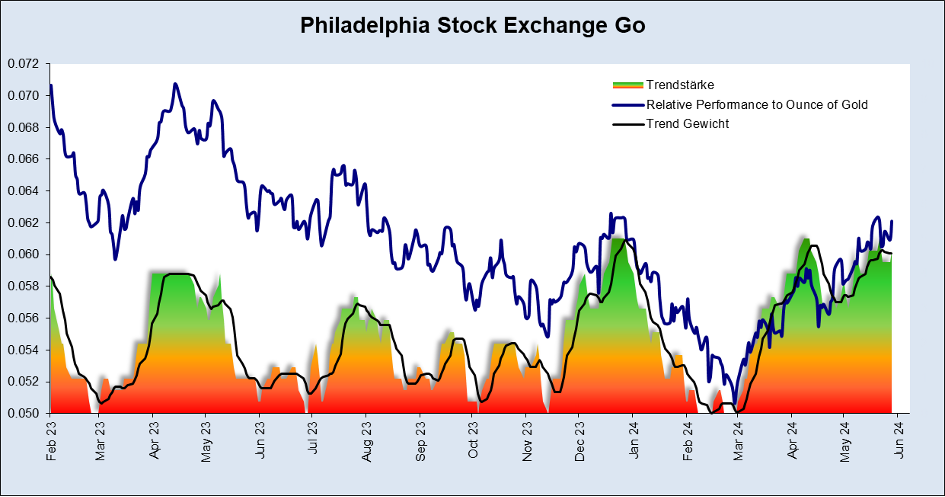
For many, the performance of the HUI Index to date has been disappointing. However, it is important to remember that the Oil price is a very important cost factor for Gold production. Accordingly, there is a very high correlation between the ratio of the HUI gold mining index and the Oil price as well as the ratio between the gold price and the HUI: if the Oil price falls in relation to the Gold price, the shares of Gold miners can see high profits…
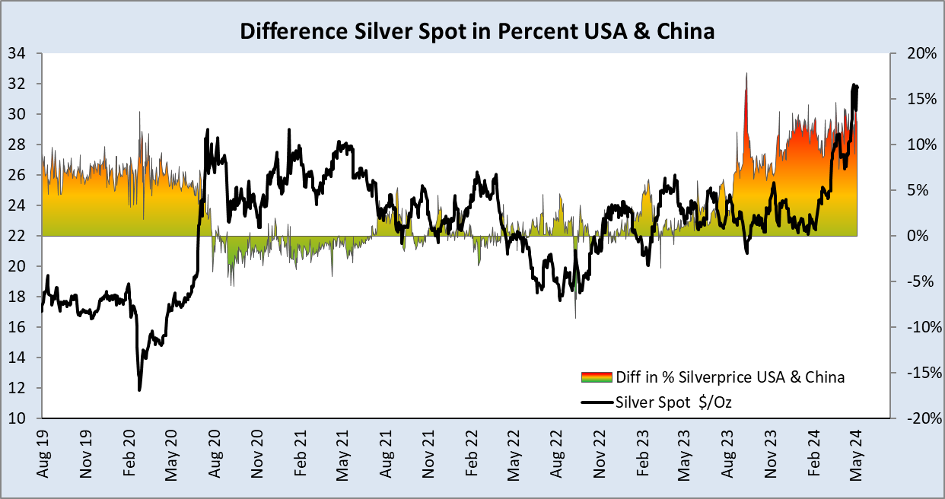
What does the near future look like? The price of Gold and Silver is being dictated by the Chinese market these days. Chinese investors in Shanghai are still paying a premium of almost 2% for physical Gold.
And they (or the olar industry) even pay a premium of 12.5 % for physical silver! As long as these premiums remain in place, we see no reason for the uptrend in Gold and Silver to come to an end…