Asian stocks finished lower today, on worries that China has put any further stimulus on hold as the economy shows signs of recovery. The Nikkei225 main index lost 0,30 percent to 22,192, the Hang Seng benchmark in Hong Kong finished 0.52 percent lower at 29,813. Chinese stocks finished mixed, with Shanghai Composite finishing 0.06 percent lower at 3,196 but in Singapore, the FTSE Straits Times index finished 0.20 percent higher at 3,360. Australian equities shot up to near the 11.5 year-high on Wednesday, fuelled by strong gains in the Healthcare, IT, Financial, Industrials, and Consumer Staples sectors. The Materials sector was the lone decliner, following weaker gold and base metals prices. The ASX 200 (XJO) closed up 62 points or 1% to 6,382 – the highest level since December 2007.
European session started mixed with investors focus on a steady stream of corporate results from US corporate heavyweights. DAX30 is 0.09 percent higher to 12,251, CAC40 is 0.20 percent lower at 5,580 while FTSE100 in London is 0.39 percent lower at 7,493 and the FTSE MIB in Milan is trading 0.12 percent lower at 21,872.
In commodities markets, crude oil holds the five-month high at 65.91 boosted by the US additional sanctions on Iran. Oil industry analysts expect that the sanctions could potentially remove up to 1.2 million barrels of oil per day from international markets. The near-term upside target that we have at the 65.00 figure has materialized and now the $67 area is the next target as the bullish momentum builds up. Brent oil also trading higher at $74,20 per barrel. Gold bearish momentum is still intact with the precious metal trading at $1270 figure. XAUUSD technical picture is negative and now the support stands at the 200-day moving average down to $1249, which if broken can accelerate the downward move to 1200 as sellers are in full control. Strong resistance stands at the $1300 round figure and then at the 50-day moving average around $1305.
In cryptocurrencies market, bitcoin (BTCUSD) whose market capitalization accounts for more than half of all other cryptocurrencies combined, continues with another leg up breaking convincingly the key 200-day moving average at $5,134, and trades at $5,600 at five-month high, making the daily low at 5,478 and daily high at 5,615. BTCUSD immediate support stands at the 200-day moving average at 5,130 while next strong support stands at the $5,000 level. Ethereum (ETHUSD) is giving up some dollars today at 169 holding nicely above the 100-day moving average, facing the immediate resistance at 193 the 200-day moving average, while Litecoin (LTCUSD) trades lost 5 dollars at 72.87. The cryptocurrencies market cap holds above $160.0B.
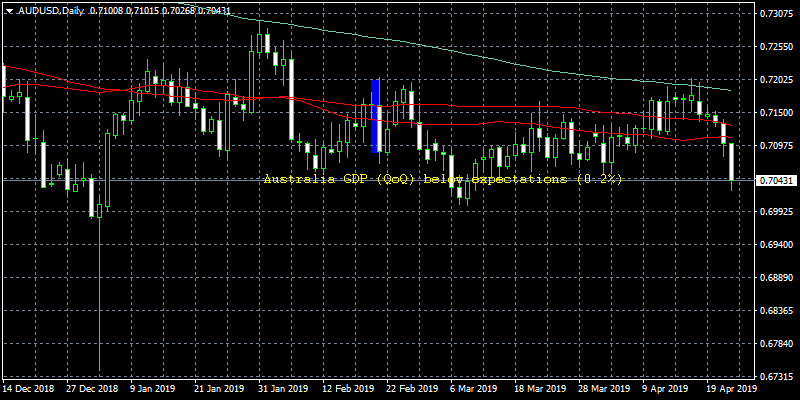
On the Lookout: Australia’s Q1 CPI came at 0.0% q/q, below analyst’s expectations, which led the markets to re-price their RBA rate cut forecasts to as soon as the next month.
In Europe, disappointing data came out today from France as the Business Climate registered at 101, below expectations (102) in April.
The Bank of Canada monetary policy decision will cross the wires at 14:00GMT and the post-policy press conference at 14:15GMT will headline the NA trading. We expect The Bank of Canada to maintain its overnight target rate at 1.75%, maintaining the pause which began last October.
Yesterday the European Central Bank Governing Council member Benoit Coeure in an interview noted that economic slowdown in Germany is stronger than expected.
Trading Perspective: In Forex markets US dollar continues north at 97,39 figure, while the Aussie dollar crushed after Q1 CPI data disappointed investors, AUDUSD is down 0.92 percent to 0.7033 as cash rate futures now see a 71.0% probability of a rate cut in next RBA meeting coming in two weeks. Kiwi mirrors the Aussie for one more day and trades lower at 0.6620.
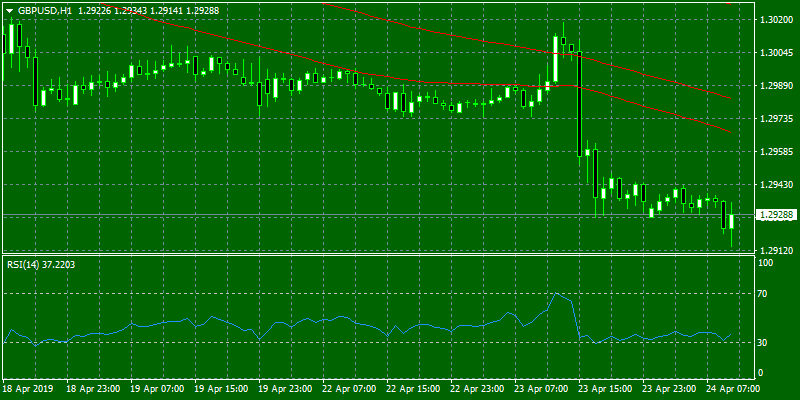
GBPUSD The pair broke lower yesterday after the two weeks consolidation at 1.3080, currently, the pair trades at 1.2922 below the key daily moving averages. On the downside, major support will be found at 1.29 round figure. On the flipside, immediate resistance stands at 1.2970 the 200-day moving average.
in Sterling futures markets the open interest rose by more than 6.3K contracts on Tuesday from Monday’s final 151,528 contracts. In the same line, volume increased by almost 73.9K contracts, reversing the previous pullback
EURUSD trades at 1.1207 at two-week low rebounding from yesterdays low at 1.1188. The pair made the Asian high at 1.1225 and the low at 1.1203. Immediate resistance can be found at the horizontal line at 1.1235 and further bids will emerge at 1.129 the 50-day moving average. On the downside, yesterday low at 1.1188 is the immediate support.
EURO remains in negative mood following recent poor figures in Eurozone. In fact, recent disappointing readings in the region somehow confirm that the slowdown in the bloc and the ‘patient-for-longer’ stance from the ECB could be among us for longer than expected.
In Euro futures markets, the open interest increased by nearly 5.1K contracts on Tuesday while volume went up by around 155.3K contracts.
USDJPY continues its consolidation just below the 112 zone, having hit the low at 111.74 and the high at 111.97. Major support for the pair stands at 111.51 the 200-day moving average and then at 111 round figure if the pair manages to break below the 100-day simple moving average at 111.10. Immediate resistance for the pair stands at 112.10 the March 2019 high.
USDCAD continues its trip north at three-week highs amid strong greenback as traders waiting for the headlines from BOC meeting later today. The pair will find immediate support at the 50-day moving average around 1.3318 while extra support stands at 1.32 and the 200-day moving average which if breached will drive prices down to 1.31 key support. On the upside, immediate resistance stands at 1.35 a break of which can escalate the rebound towards 1.3530.