This article was submitted by Antreas Themistokleous, an analyst at Exness.
This preview of weekly data looks at USOIL and XAUUSD where economic data coming up later this week are the main market drivers for the near short-term outlook.
Highlights this week: British unemployment and inflation, ECB interest rate decision, Chinese industrial production
Tuesday:
- Chinese Balance of trade at 03:00 AM GMT where the figure for the month of September is expected to decrease from $02 Billion to $89.8 Billion. If this is broadly accurate then it might create some losses for the currency in the immediate aftermath of the release.
- British unemployment at 06:00 AM GMT for the month of August is expected to hold steady at 4.1% while the claimants are expected to decrease to 20,200 for the month of September compared to the previous recording of 23,700.
Wednesday:
- UK inflation rate at 06:00 AM GMT. The consensus is for a decline from 2.2% to 1.9% in September. If the consensus is correct then it would be a 3-year-low figure of British inflation and could potentially create some short minor losses for the quid since it could influence the decisions of the Bank of England on their next meeting.
- Japanese Balance of trade at 11:50 PM GMT where the expectations are for a decline in the trade deficit from ¥-695.3 billion to ¥-237.6 billion for the month of September. If the expectations are correct then the yen could face some support against the currencies traded against it.
Thursday:
- ECB Interest rate decision at 12:15 GMT. The market consensus is that the central bank of Europe will make another rate cut going from the current 3.65% to 3.4%. On the other hand, a lower rate would create some minor losses for the Euro against its pairs mainly the US dollar. Investors and traders are also focused on the subsequent press conference following the release which will be rather insightful on getting hints on the monetary policy steps ahead.
- Japanese inflation rate at 23:30 GMT. The expectations for the month of September is that the rate could go down to 2.7% from the previous 3%. This might be somewhat bearish news to the market participants trading the yen.
Friday:
- Chinese industrial production at 02:00 AM GMT. Industrial production from China for the month of September where the market is expecting an increase of 0.1% reaching 4.6%. If this is broadly accurate we might see some profits in the production-related instruments like crude oil, silver, and copper.
USOIL, daily
Crude oil prices dropped at the start of the week, influenced by economic news from China, particularly lower-than-expected September inflation data. Consumer prices rose by only 0.4%, missing the anticipated 0.6%. While lower prices often boost oil demand, the market interpreted this as a sign of weakening demand due to slower inflation. Despite China’s government announcing a new stimulus plan, its lack of specifics, particularly on the size of the stimulus, led traders to doubt its impact on oil prices. As a result, focus shifted away from Middle Eastern tensions to concerns about China’s oil demand. This comes even as the U.S. expanded sanctions against Iran, targeting its oil tanker fleet.
On the technical side, the price has made an aggressive pullback to around the $75 price area and found sufficient resistance on the 23.6% of the daily Fibonacci retracement level as well as the 100-day moving average pushing the price back down where it currently tests the support zone of the 38.2% of the daily Fibonacci level. The stochastic oscillator is near the extreme overbought levels but its trajectory is back to neutral levels therefore we might not see a major correction to the downside but rather a smooth decline in the price in the near short-term. The confirmation of the overall bearish trend in the market by the moving averages also supports the possible decline. If this scenario is confirmed we might see a retreat of the support area around $72 level.
Gold-dollar, daily
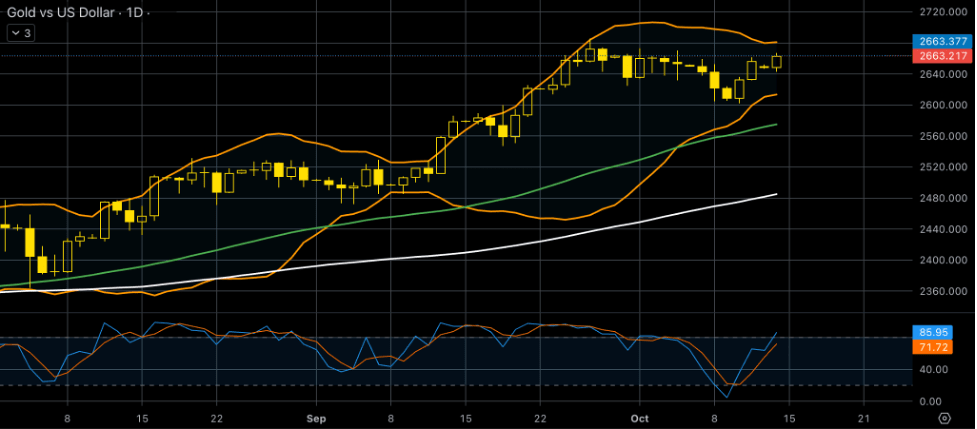
Gold prices saw dip-buying and approached a one-week high near $2,660, supported by favorable US inflation data and rising geopolitical tensions in the Middle East. The US Producer Price Index (PPI) showed a deceleration in inflation, suggesting that the Federal Reserve may cut interest rates further, but the market has ruled out a significant rate cut in November. However, elevated US Treasury yields and a strong US Dollar limited gold’s gains. Optimism around China’s economic stimulus also led to investor caution. With US markets closed for Columbus Day, gold prices remain sensitive to USD movements and geopolitical developments.
From a technical point of view, the price resumed the bullish momentum after a minor correction in late last week. The Stochastic oscillator is still near the extreme overbought levels but this is not a major indicator for yet another correction to the downside. The 50-day moving average is still trading way above the slower 100-day moving average validating the overall bullish trend in the market while the Bollinger bands have contracted hinting that volatility might be dried up in the market for gold. With the U.S market closed in the first day of the week the Bollinger bands are not expected to have any major shifts therefore no major moves are expected.
Disclaimer: the opinions in this article are personal to the writer and do not reflect those of Exness or Finance Feeds.