By Giles Coghlan, Chief Currency Analyst, HYCM
Articles discussing, calling for, and setting up criteria for the bitcoin bottom have now been streaming in for a good few months. On June 15, when bitcoin was trading somewhere between $38k and $40k, Fidelity’s director of a global macro called the bottom. In fact, this bottom-calling has been going on since May, when the number one cryptocurrency dipped below $40k for the first time since February. Ever since the last leg of that May sell-off, bitcoin has been trading in a range between the May lows of around $30,155 and June’s high of $41,500, with the exception of a sudden intra-day dip below $30k that occurred on June 21.
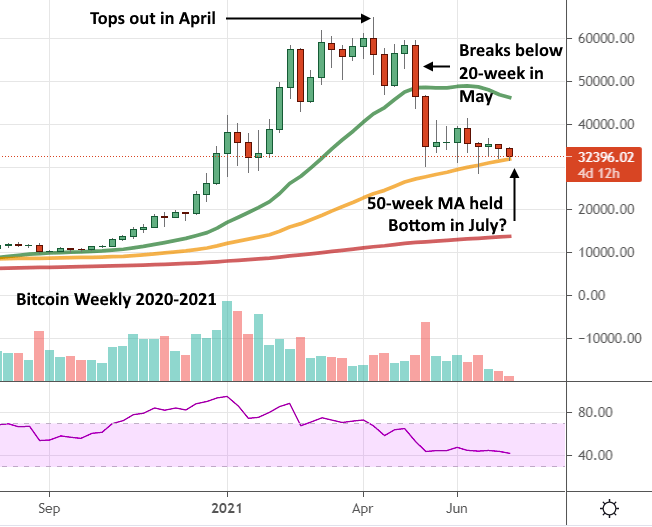
Over the past year or so at HYCM, we too have been covering bitcoin’s support and resistance levels as the price have threatened to cross them (initially on the way up, and more recently on the way down). Perhaps the most noteworthy of these has been the 20-week moving average, which bitcoin failed to hold back in early May, and is normally considered a harbinger of more drawn-out bearish activity to follow. With that particular line in the sand now clearly washed away, many investors who are not prepared to accept the recent activity as evidence of a cycle top, are searching for new lines and alternative historical parallels to suggest that the party isn’t over yet.
Moving the Goalposts
The simplest of these has been to move the goalposts slightly and look for evidence that the next important moving average is holding. For instance, when the 20-day, 50-day and 100-day moving averages all failed as support on the same day back in early May, the focus switched to the 200-day, which also failed to hold about a week later.
Similarly, with the price crossing that important 20-week MA to the downside on the week of May 10, the next significant point of support was the 50-week. The price is still currently respecting this level, despite having repeatedly tested it over the past 6 weeks or so. Should this fail, the next level to look at will inevitably be the 100-week (currently sitting at around $20k). If that takes place, then bitcoin will have effectively retraced its entire move up since December of last year. This lends further credence to the argument that this is indeed to be a lengthier bear market with a further downside in store as we head into the capitulation phase. If it drops to the 200-week, then bitcoin gives back all the gains of this market cycle, taking it back to where it was trading in October of 2020 at around $14k.
Similarities with 2013
Another view is that this particular bull market bears a resemblance to the one of 2013 when bitcoin made two significant tops in the same year. This possibly had something to do with how fast and hard the asset initially rallied (just like it has this year), leading to a protracted intra-cycle correction, followed by a second leg up later in the year.
2013 was also the only bull market other than this recent one where bitcoin closed below the 20-week MA without this signalling an end to the bullish bias. The first peak took place in the week of April 8, 2013, at around $260. This was followed by a clear bottom in mid-July at around $62, and around six months of consolidation, resulting in a bullish break in October that took bitcoin up to well over $1000 in less than two months.
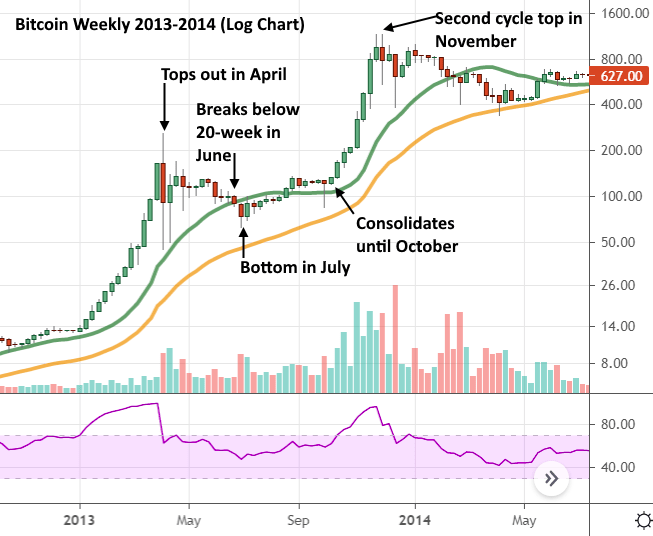
So, we have a bull market that ran too fast and too hard, a current market peak in the week of April 12, and a dip below the 20-week moving average, all mirroring 2013. If past is prologue, then the current retracement to the 50-week MA at just over $30k could signal the bottom of this consolidation phase. Perhaps what’s in store is further sideways action through the summer and autumn, leading to a spectacular year-end for the asset come winter.
Of course, all this is just speculation, pattern-matching and drawing one line in the sand after the other until one of them holds. The truth is that prior cycles only make sense because we’re analysing them in hindsight, and current price action is always a mystery until it too can be viewed through a historical lens. So, what can we really say about the current bitcoin market and its prospects for the rest of the year?
3 Things to Think About
Whether the recent sell-off is the bottom or not, the asset does not seem quite ready to resume its upward path just yet. Here we can use those same moving averages in a different way, to see how they’re lining up with each other. For example, in a strongly trending bull market, you expect to see moving averages lining up from shortest to longest (i.e. 20/50/100/200), whereas in a strongly trending bear market you’d expect to see them lining up the opposite way (200/100/50/20).
However, at the end of a lengthy consolidation, when the trading range tightens and the market has yet to pick a definite direction, you tend to see them narrowing in on each other so that when the change of trend is initiated, they are all broken in one go. We’re still a way off from this situation, even on the daily chart, let alone the weekly, which suggests that the range hasn’t tightened quite enough yet.
Secondly, when an asset really wants to rise, no amount of bad news can keep it down. When an asset really wants to fall, no amount of good news can hope to buoy it up. We’re currently at a stage where bitcoin has already come down 50%, and even though there has been news that should be seen as positive for the cryptocurrency (hash rate stabilising post-China ban, Elon softening on Tesla accepting it again, US inflation soaring), there seem to be no bulls in sight. If previous cycles are anything to go by, this dynamic can hold for long stretches of time.
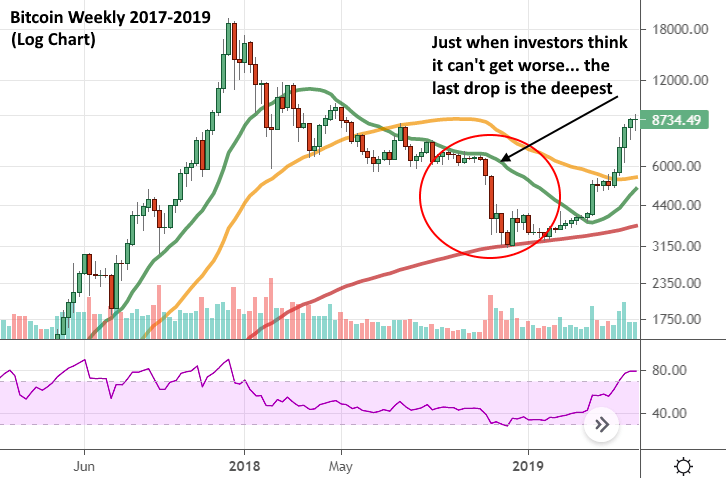
Finally, and perhaps most importantly for those looking to buy the dip, very often markets overshoot on both the way up and the way down. Just when investors think that all the selling is over, it’s common to see one last drop that’s often a bigger drop than any of the others, just to completely wash out the weak hands before a trend change is initiated. We clearly haven’t had this yet in bitcoin, even though we’re currently seeing it in some of the other cryptocurrencies. As mentioned above, a tumble all the way down to the 200-week (the red line above) typically signals capitulation. We may not see such a drop, but being alert to the possibility of one last leg down will hopefully encourage you to pick your limit-buy levels wisely.
Note: Cryptocurrencies are not available for trading under HYCM (Europe) Ltd and Henyep Capital Markets (UK) Ltd.